Importante
A tradução é um esforço comunitário você pode contribuir. Esta página está atualmente traduzida em 44.20%.
14.6. Lesson: Creating Detailed Maps with the Atlas Tool
El diseño de muestreo sistemático está listo y los equipos de campo han cargado las coordenadas GPS en sus sistemas de navegación. También tienen un formulario de datos de campo donde colectarán la información medida en cada parcela de muestreo. Para encontrár más fácilmente su camino a cada parcela de muestreo, ellos han pedido un número de mapas detallados donde se puede ver claramente alguna información sobre el terreno junto con un pequeño conjunto de parcelas de muestreo y otra información sobre el área del mapa. Puedes utilizar la herramienta Atlas para generar automáticamente un número de mapas con un formato común.
El objetivo de esta lección: Aprender a utilizar la herramienta Atlas en QGIS para generar mapas detallados que se puedan imprimir para asistir en el trabajo de inventario de campo.
14.6.1. ★☆☆ Follow Along: Preparing the Print Layout
Antes de que podamos automatizar los mapas detallados de la mayoría del área forestal y nuestras parcelas de muestreo, necesitamos crear una plantilla de mapa con todos los elementos que consideremos útiles para el trabajo de campo. Por supuesto lo más importante será un un estilo apropiado, pero como has visto anteriormente, también necesitarás añadir muchos otros elementos que completen el mapa impreso.
Open the QGIS project from the previous lesson
forest_inventory.qgs. You should have at least the following layers:forest_stands_2012 (with a 50% transparency, green fill and darker green border lines)
systematic_plots_clip
rautjarvi_aerial
Save the project with a new name,
map_creation.qgs.
To create a printable map, remember that you use the Layout Manager:
In the Layout manager dialog:
Under New from template, press the Create… button next to the Empty layout entry
Name your print layout
forest_map.Press OK. A new print layout is created and opened, showing a blank paper.
In the print Layout window, ensure properties are set for an A4 paper:
Right-click over the paper and select Page properties. The Page properties panel is open on the right side of the layout.
Check Size is A4.
Check Orientation is Landscape.
Enable the Layout tab next to the Page properties panel and set Export resolution to
300 dpi.
Composing a map is easier if you make use of the canvas grid to position the different elements. Review the settings for the layout grid:
In the Layout tab expand the Guides and Grid region.
Check that Grid spacing is set to
10 mmand that Snap tolerance is set to5 px.
Necesitas activar el uso de la cuadrícula:
Abre el menú .
Habilita Show grid.
Habilita Snap to grid.
Notice that options for using Guides are checked by default, which allows you to see guiding lines when you are moving elements in the layout.
Now you can start to add elements to your layout. Add first a map element so you can review how the map canvas looks as you will be making changes in the layers symbology:
Haz clic y arrastra la caja en el lienzo para que el mapa ocupe la mayor parte.
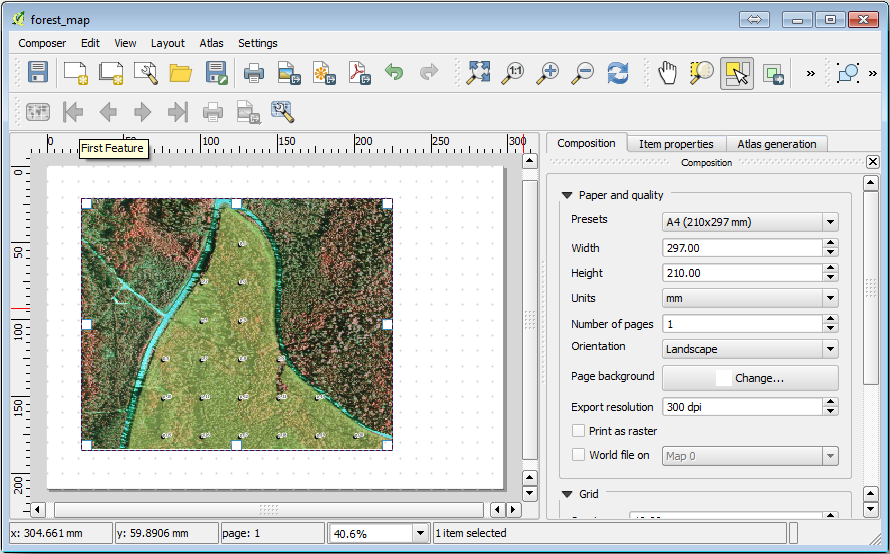
Observa cómo el cursor del ratón se ajústa al lienzo en cuadrícula. Utiliza esta función cuando añadas otros elementos. Si quieres tener más precisión, cambia los ajustes de cuadrícula Spacing. Si por alguna razón no quieres forzar el cursor a la cuadrícula en algún momento, siemper puedes habilitarlo o deshabilitarlo en el menú .
14.6.2. ★☆☆ Follow Along: Adding Background Map
Leave the layout open but go back to the map. Let’s add some background data and create some styling so that the map content is as clear as possible.
Add the background raster
basic_map.tifthat you can find in theexercise_data\forestry\folder.If prompted select the ETRS89 / ETRS-TM35FIN CRS for the raster.
Como puedes ver el mapa base ya está estilizado. Este tipo de rásters cartográficos listos para utililar es muy común. Está creado a partir de datos vectoriales, estilizado en un formato estándar y guardado como un ráster para que no tengas que dar estilo a muchas capas vectoriales y preocuparte de obtener un buen resultado.
Ahora amplía tus parcelas de muestreo, para poder ver solo cuatro o cinco líneas de parcelas.
The current styling of the sample plots is not the best:
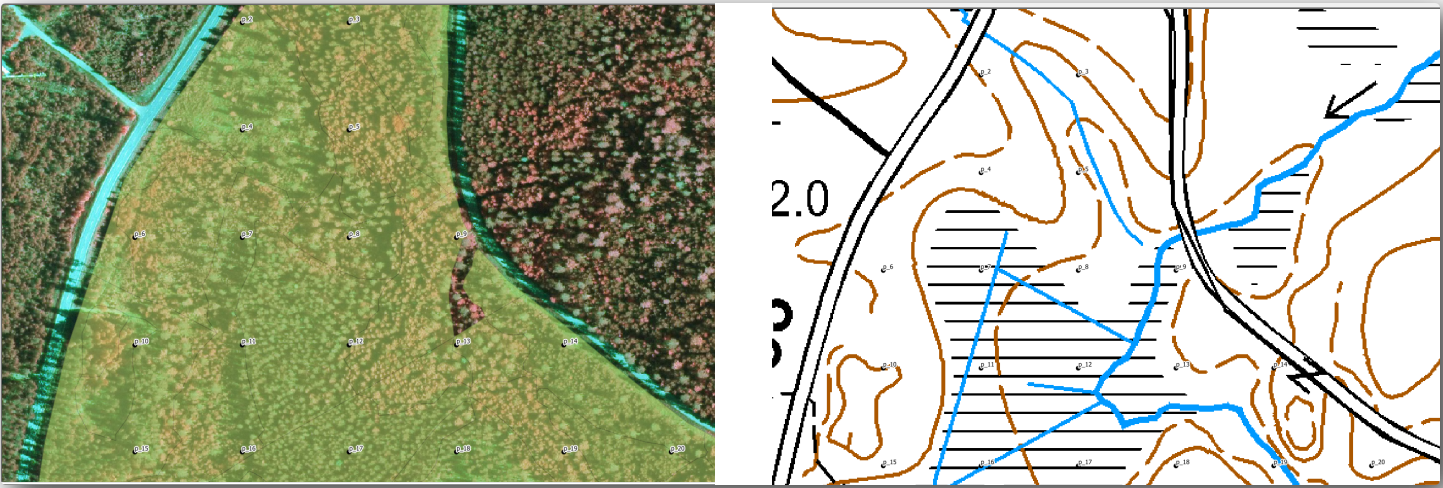
While during the last exercises, the white buffer was OK on top of the aerial image, now that the background image is mostly white you barely can see the labels. But how does it look in the print layout? Let’s check it:
Go to the print layout window.
Use the
 Select/Move item button to select the map element
in the layout.
Select/Move item button to select the map element
in the layout.Ve a la pestaña Item properties.
If you need to refresh the element, click on
 Update map preview.
Obviously this is not good enough; you want to make the plot numbers as clearly visible as possible for the field teams.
14.6.3. ★☆☆ Try Yourself: Changing the Symbology of the Layers
O exemplo trabalhando em Módulo: Criando e Explorando um Mapa Básico com simbologia em Module: Classifying Vector Data com etiquetas. Retorna a este módulo sem necessitar referencia sobre algumas das opções e ferramentas disponíveis. Seu objetivo é conseguir que os locais das parcelas e os nomes sejam tão visiveis quanto possível, pois sempre permitindo ver os elementos do mapa de fundo. Pode tomar alguma orientação nesta imagem:
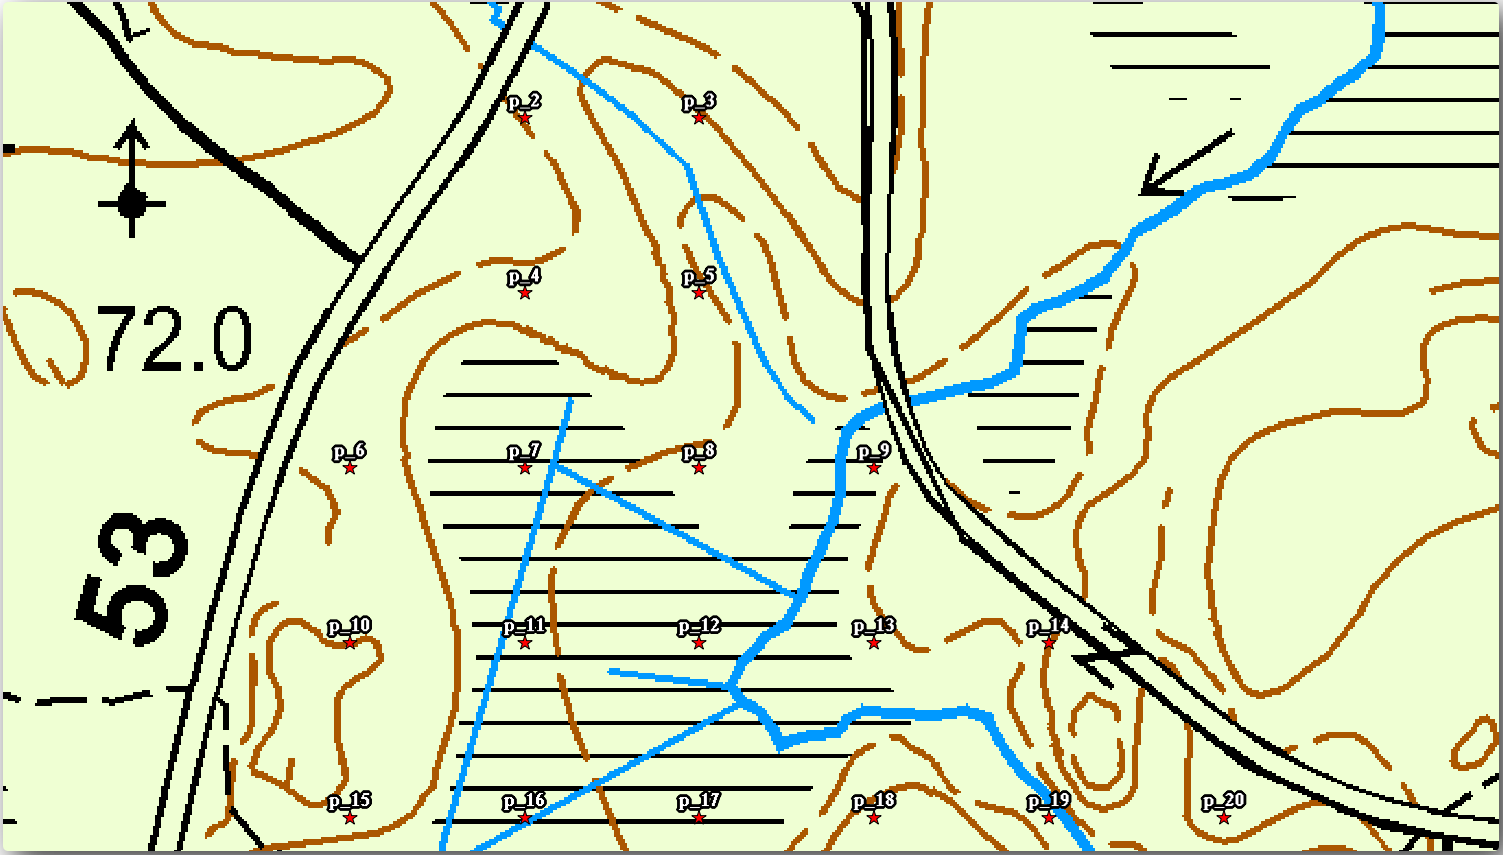
You will use later the the green styling of the forest_stands_2012 layer.
In order to keep it, and have a visualization of it that shows only the stand borders:
Right click on forest_stands_2012 and select Duplicate
You get a new layer named
forest_stands_2012 copythat you can use to define a different style, for example with no filling and red borders.Ahora tienes dos visualizaciones diferentes de las masas forestales y puedes decidir cual visualizar en tu mapa detallado.
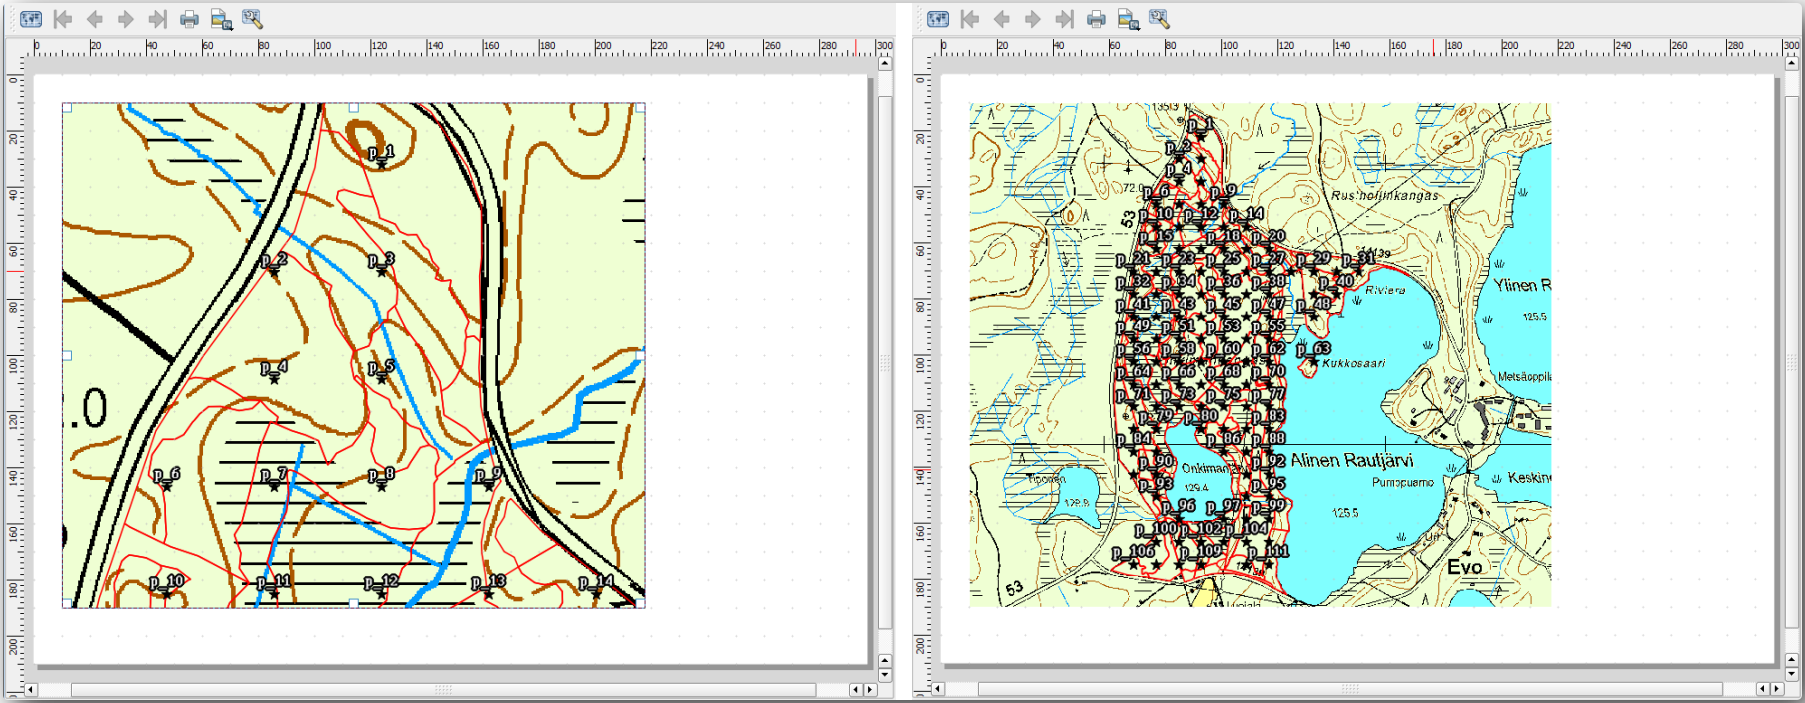
Go back to the print layout window often to see what the map would look like. For the purposes of creating detailed maps, you are looking for a symbology that looks good not at the scale of the whole forest area (left image below) but at a closer scale (right image below). Remember to use
 Update map preview and
  Set map extent to match main canvas extent
whenever you change the zoom in your map or the layout.
14.6.4. ★☆☆ Try Yourself: Create a Basic Map Template
Once you have a symbology you are happy with, you are ready to add some more information to your printed map. Add at least the following elements:
Título.
Una barra de escala.
Una cuadrícula para tu mapa.
Coordenadas en los bordes de la cuadrícula.
You have created a similar layout already in Module: Laying out the Maps. Go back to that module as you need. You can look at this example image for reference:
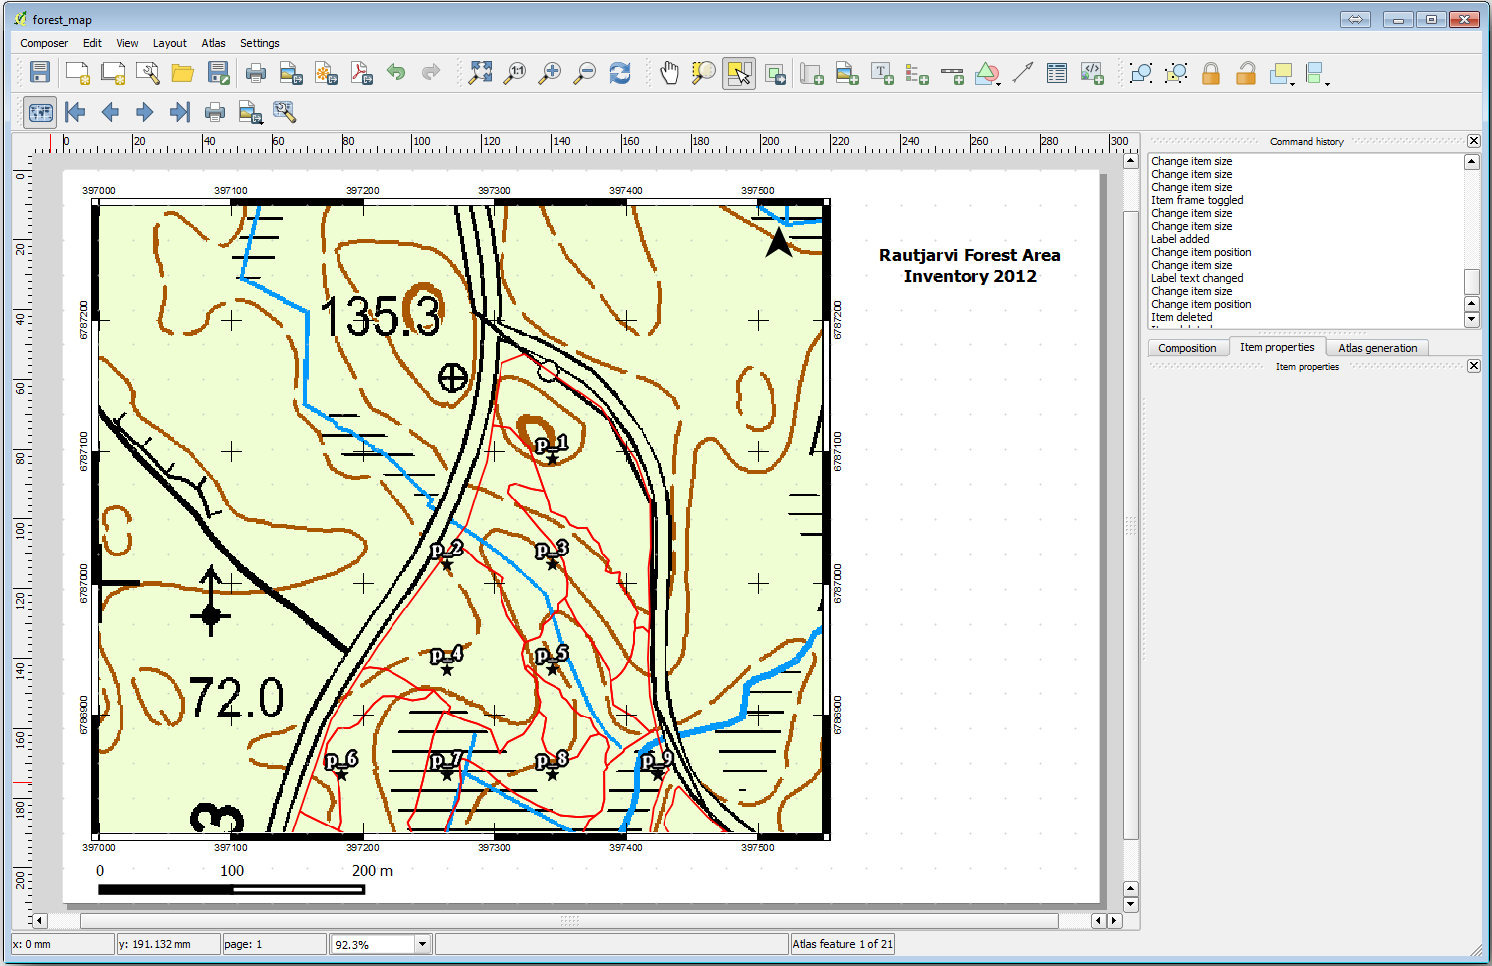
Exporta tu mapa como una imagen y revísalo.
.
Use for example the JPG format.
Así es como se verá cuando esté impreso.
14.6.5. ★☆☆ Follow Along: Adding More Elements to the Print Layout
Como probablemente hayas observado en las imágenes sugeridas de plantilla de mapa, hay espacio de sobra en la parte derecha del lienzo. Vamos a ver qué más podría haber ahí. Para los propósitos de nuestro mapa, una leyenda no es realmente necesaria, pero un mapa resumen y algunas cajas de texto podrian añadir valor al mapa.
El mapa resumen ayudará a los equipos de campo a situar al mapa detallado dentro del área forestal general:
Añade otro elemento del mapa al lienzo, justo bajo el texto del título.
En la pestaña Item properties, abre el menú desplegable Overview.
Ajusta Overview frame a Map 0. Esto crea un rectángulo sombreado encima de un mapa más pequeño representando la extensión visible del mapa grande.
Check also the Frame option with a black color and a Thickness of
0.30.
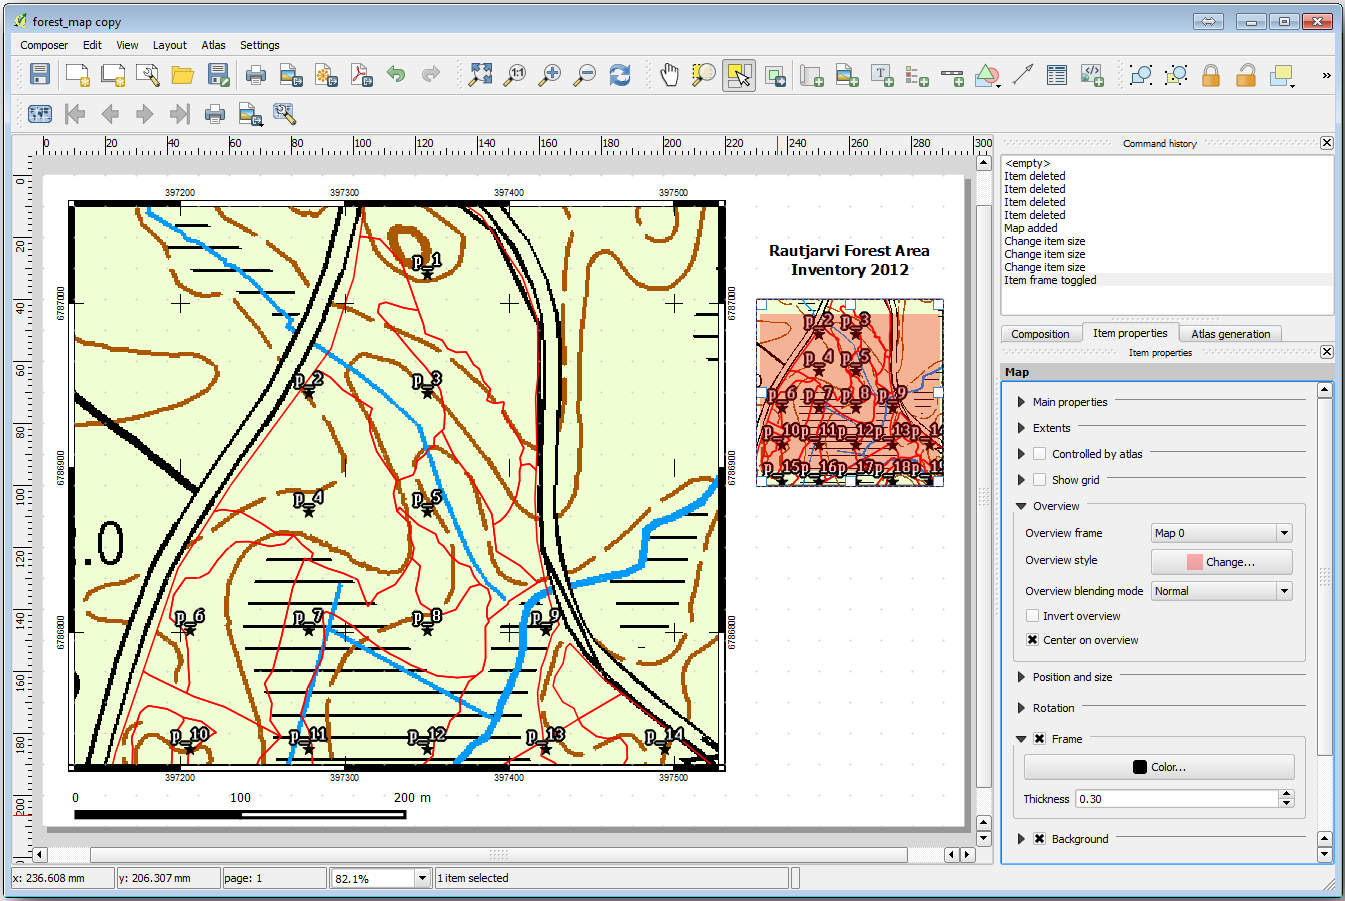
Notice that your overview map is not really giving an overview of the forest
area which is what you want. You want this map to represent the whole forest
area and you want it to show only the background map and the
forest_stands_2012 layer, and not display the sample plots. And also
you want to lock its view so it does not change anymore whenever you change
the visibility or order of the layers.
Volte para o mapa, mas não feche o :guilabel:`Layout de impressão’.
Right click the forest_stands_2012 layer and click on Zoom to Layer Extent.
Deactivate all layers except for basic_map and forest_stands_2012.
Expand the Manage map themes tool on the Layers panel and select Add theme.
Name it
basic_overview.Go back to the print layout.
With the small map selected, click the Set map extent to match main canvas extent to set its extents to what you can see in the map window.
Lock the view for the overview map by checking Follow map theme and selecting
basic_overviewunder Main properties.
Now your overview map is more what you expected and its view will not change anymore. But, of course, now your detail map is not showing anymore the stand borders nor the sample plots. Let’s fix that:
Go to the map window again and select the layers you want to be visible (
systematic_plots_clip,forest_stands_2012 copyandBasic_map).Vuelve a ampliar el zoom para tener visibles solo unas pocas líneas de parcelas de muestreo.
Voltar para a janela :guilabel:`Layout de impressão’.
Select the bigger map in your layout.
In Item properties click on Update preview and Set map extent to match main canvas extent.
Observa que solo el mapa grande se muestra en la vista actual del mapa, y el mapa resumen pequeño se mantiene en la misma vista en que lo bloqueaste.
También observa que la visión general está mostrando una franja sombreada de la extensión mostrada en el mapa detallado.
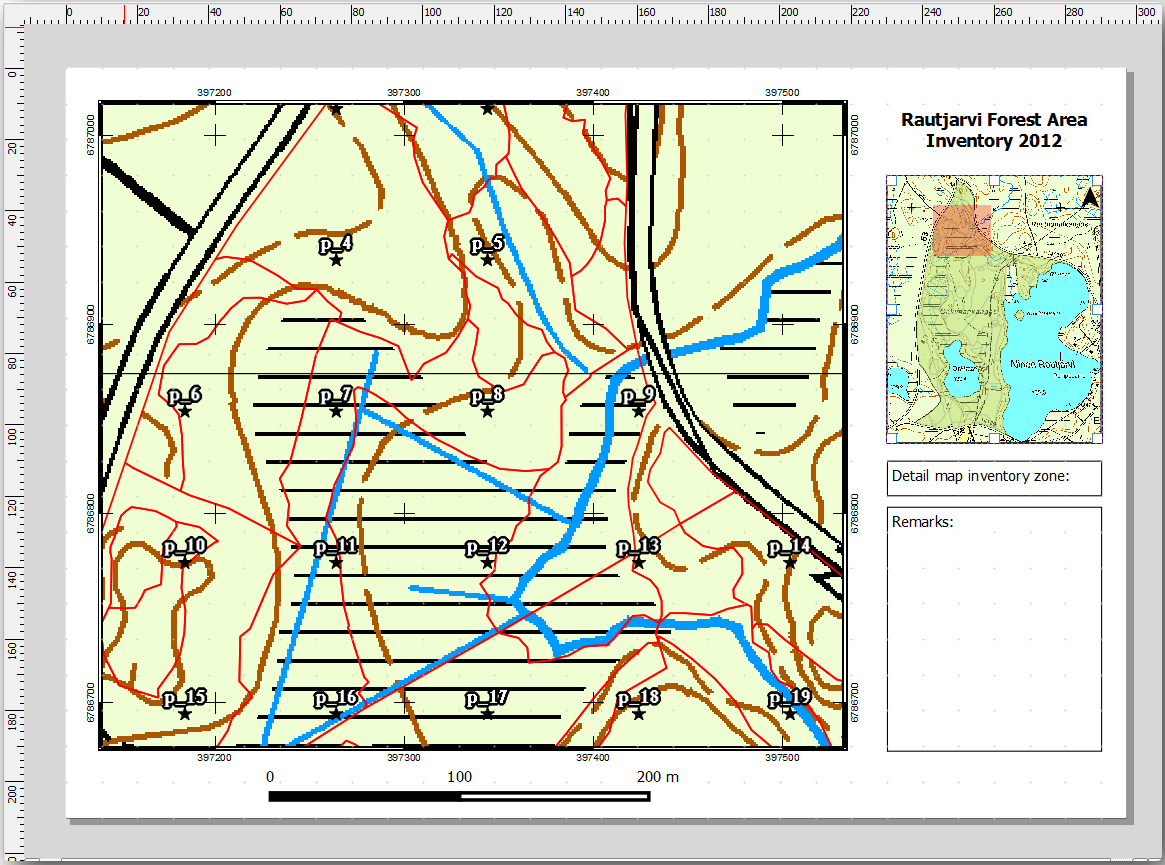
Tu plantilla está casi lista. Añade ahora dos cajas de texto bajo el mapa, una conteniendo el texto ‘Detailed map zone: ‘ y la otra ‘Remarks: ‘. Sitúalas para que puedas verlas en la imágen superior.
También puedes añadir una flecha de Norte al mapa resumen:
Click and drag a rectangle at the upper right corner of the overview map.
In Item properties Check SVG image
Browse for an arrow image.
Under Image rotation, check the Sync with map and select Map 1 (the overview map).
Ajusta el tamaño de la flecha para que quede bien en el mapa pequeño.
The basic map layout is ready, now you want to make use of the Atlas tool to generate as many detail maps in this format as you consider necessary.
14.6.6. ★☆☆ Follow Along: Creating an Atlas Coverage
A cobertura poderia ser uma camada existente, pois normalmente faz mais sentido criar uma para o propósito específico. Vamos criar uma malha de polígonos cobertos na área florestal:
La cubierta podría ser una capa existente, pero normalmente tiene más sentido crear una para el propósito específico. Vamos a crear una maya de polígonos cubriendo el área forestal:
Ajusta la herramienta como se muestra en la imagen:
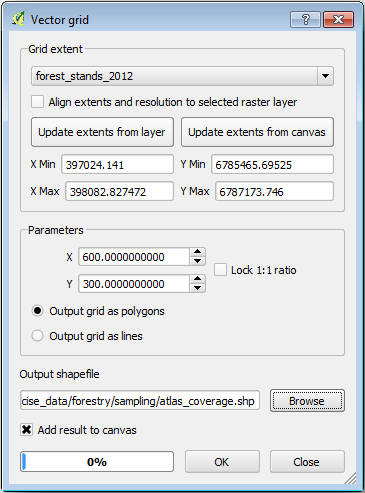
Save the output as
atlas_coverage.shp.Style the new
atlas_coveragelayer so that the polygons have no filling.
Os novos polígonos estão cobrindo toda a superfície florestal e lhe dão uma idéia de que cada mapa (criado a partir de cada polígono) conterá.
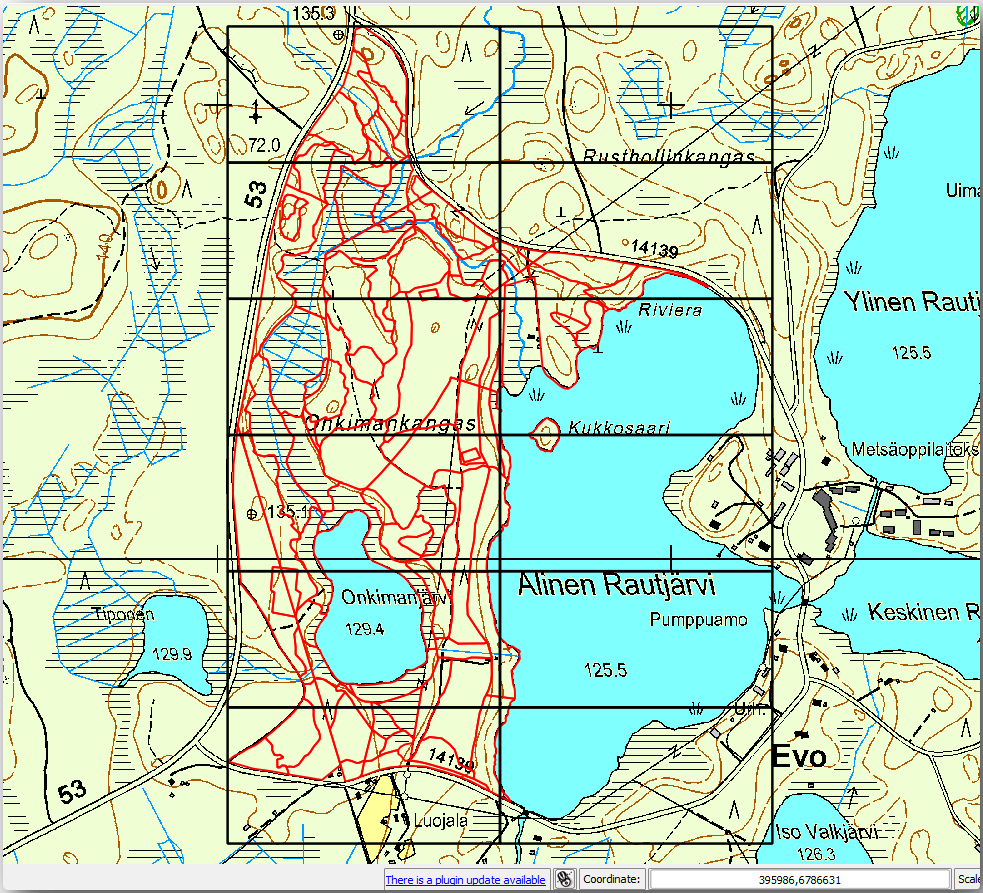
14.6.7. ★☆☆ Follow Along: Setting Up the Atlas Tool
El último paso es configurar la herramienta Atlas:
Go back to the print layout.
En el panel de la derecha, ve a la pestaña Atlas generation.
Configura las opciones como sigue:
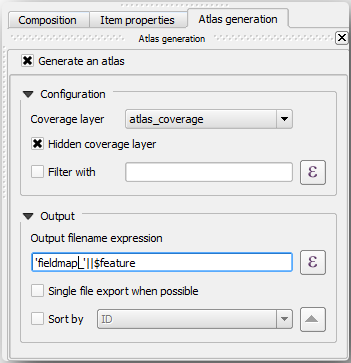
That tells the Atlas tool to use the features (polygons) inside
atlas_coverageas the focus for every detail map. It will output one map for every feature in the layer. The Hidden coverage layer tells the Atlas to not show the polygons in the output maps.
Una cosa más debe hacerse. Necesitas decirle a la herramienta Atlas qué elemento del mapa será actualizado para cada mapa de salida. Por ahora, probablemente puedes suponer que el mapa a ser cambiado para cada elemento es uno de los que has preparado para contener vistas detalladas de las parcelas de muestreo, que es el elemento más grande del mapa de tu lienzo:
Select the bigger map element (
Map 0).Ve a la pestaña Item properties.
En la lista, habilita Controlled by atlas.
And set the Marging around feature to
10%. The view extent will be 10% bigger than the polygons, which means that your detail maps will have a 10% overlap.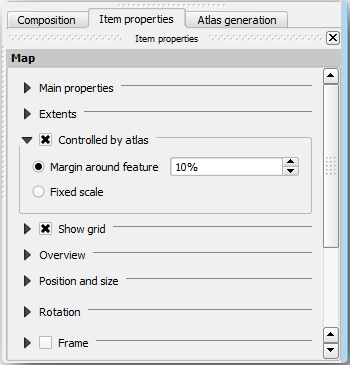
Ahora puedes utilizar la herramienta de vista previa para los mapas Atlas para revisar que todos tus mapas se ven así:
Activate the Atlas previews using the button
 or if your Atlas toolbar
is not visible, via .
or if your Atlas toolbar
is not visible, via .Puedes utilizar las flechas de la barra del menú de la herramientas Atlas para moverte a través de los mapas que serán creados.
Note that some of them cover areas that are not interesting. Let’s do something about it and save some trees by not printing those useless maps.
14.6.8. ★☆☆ Follow Along: Editing the Coverage Layer
En lugar de borrar los polígonos para esas áreas que no son interesantes, puedes también personalizar las etiquetas de texto en tu mapa a generar con contenido de la Attribute table de tu capa de cobertura:
Vuelve a la vista del mapa.
Enable editing for the atlas_coverage layer.
Selecciona los polígonos que están seleccionados (en amarillo) en la imagen inferior.
Borra los polígonos seleccionados.
Guarda y deshabilita la edición.
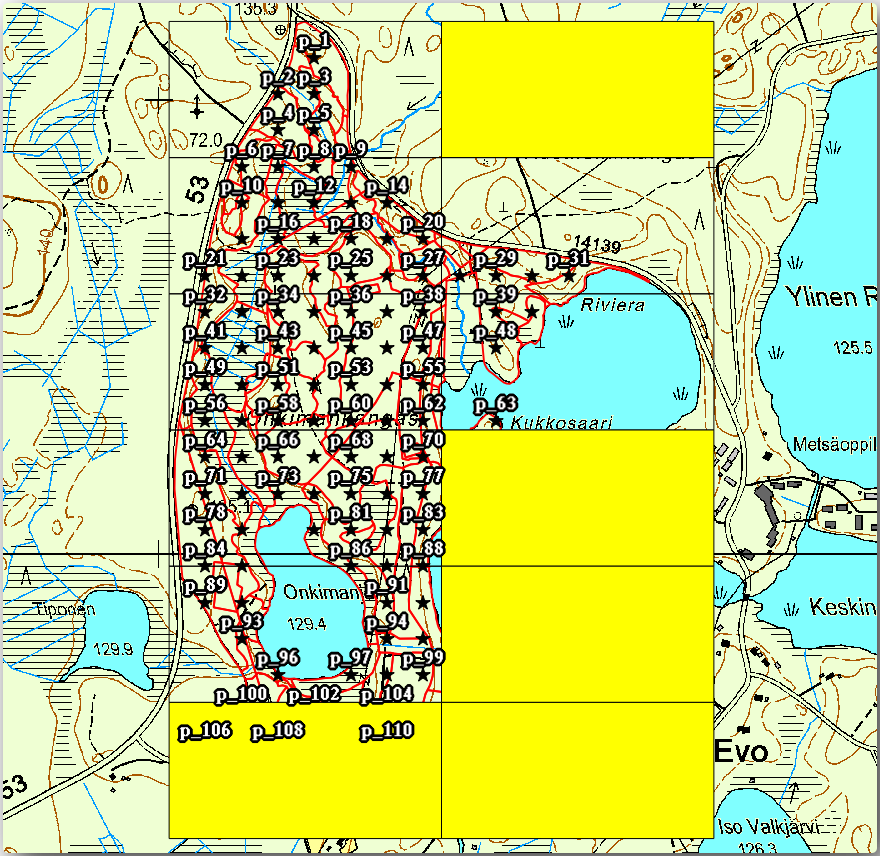
You can go back to the print layout and check that the previews of the Atlas use only the polygons you left in the layer.
La capa de cobertura que estás utilizando todavía no tiene información útil que podrías utilizar para personalizar el contenido de las etiquetas en tu mapa. El primer paso es crearlas, puedes añadir por ejemplo un código de zona para las áreas de los polígonos y un campo con algunas observaciones para que los equipos de campo tengan en cuenta:
Open the Attribute table for the atlas_coverage layer.
Habilita la edición.
Use the
 calculator to create and populate the following two fields.
Create a field named
Zoneof type Whole number (integer).In the Expression box write/copy/construct
@row_number.Create another field named
Remarks, of type Text (string) and a width of255.In the Expression box write
'No remarks.'. This will set all the default value for all the polygons.
The forest manager will have some information about the area that might be useful when visiting the area. For example, the existence of a bridge, a swamp or the location of a protected species. The atlas_coverage layer is probably in edit mode still, add the following text in the Remarks field to the corresponding polygons (double click the cell to edit it):
For the Zone 2:
Bridge to the North of plot 19. Siberian squirrel
between p_13 and p_14.
For the Zone 6: Difficult to transit in swamp to the North of the lake.`
For the Zone 7:
Siberian squirrel to the South East of p_94.Desactiva y guarda la edición.
Almost ready, now you have to tell the Atlas tool that you want some of the text labels to use the information from the atlas_coverage layer’s attribute table.
Voltar para :guilabel:`Layout de impressão’.
Select the text label containing
Detailed map....Set the Font size to
12.Ajusta el cursor al final del texto en la etiqueta.
In the Item properties tab, inside the Main properties click on Insert or Edit an Expression….
In the Function list double-click on the field Zone under Field and Values.
Haz clic en Aceptar.
The text inside the box in the Item properties should show
Detail map inventory zone: [% "Zone" %]. Note that the[% "Zone" %]will be substituted by the value of the field Zone for the corresponding feature from the layer atlas_coverage.Comprueba el contenido de la etiqueta mirando diferentes mapas de vista previa de Atlas.
Do the same for the labels with the text Remarks: using the field with the zone information. You can leave a break line before you enter the expression. You can see the result for the preview of zone 2 in the image below:
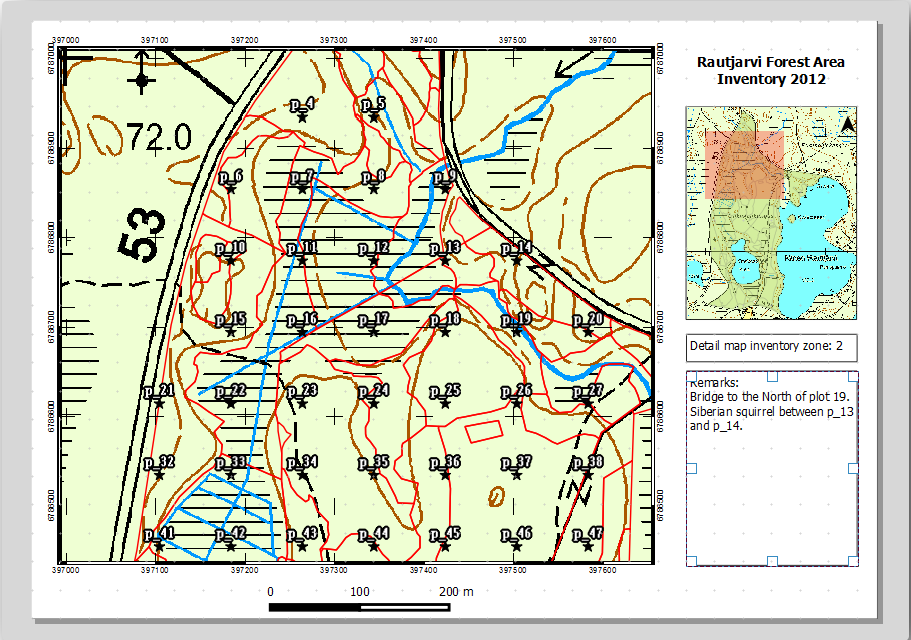
Utiliza la vista previa del Atlas para navegar a través de todos los mapas que crearás pronto, ¡y disfrútalo!
14.6.9. ★☆☆ Follow Along: Printing the Maps
Por último pero no menos importante, imprimir o exportar tus mapas a archivos de imagen o archivos PDF. Puedes utilizar o . Actualmente la exportación a formato SGV y funciona correctamente y dará malos resultados.
Vamos a imprimir los mapas como un archivo PDF que puedes enviar a la oficina de campo para imprimir:
Ve a la pestaña Atlas generation en el panel derecho.
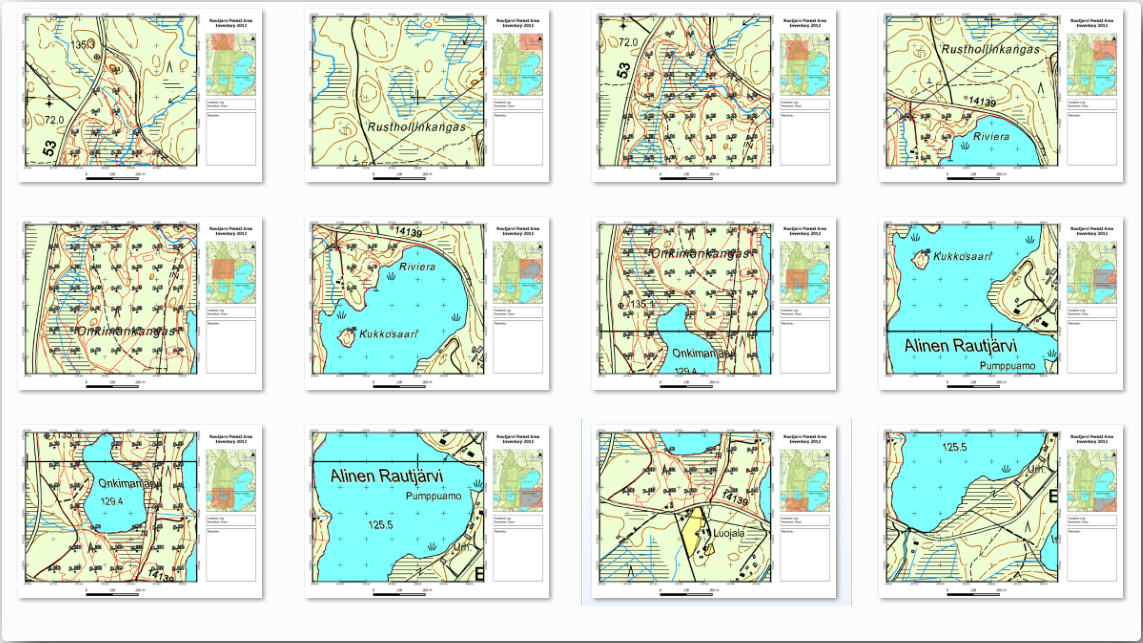
En Output activa Single file export when possible. Esto pondrá todos los mapas juntos en un archivo PDF, si esta opción no está activada obtendrás un archivo para cada mapa.
Abra .
Save the PDF file as
inventory_2012_maps.pdfin yourexercise_data\forestry\samplig\map_creation\folder.Abre el archivo PDF para comprobar que todo fué como esperabas.
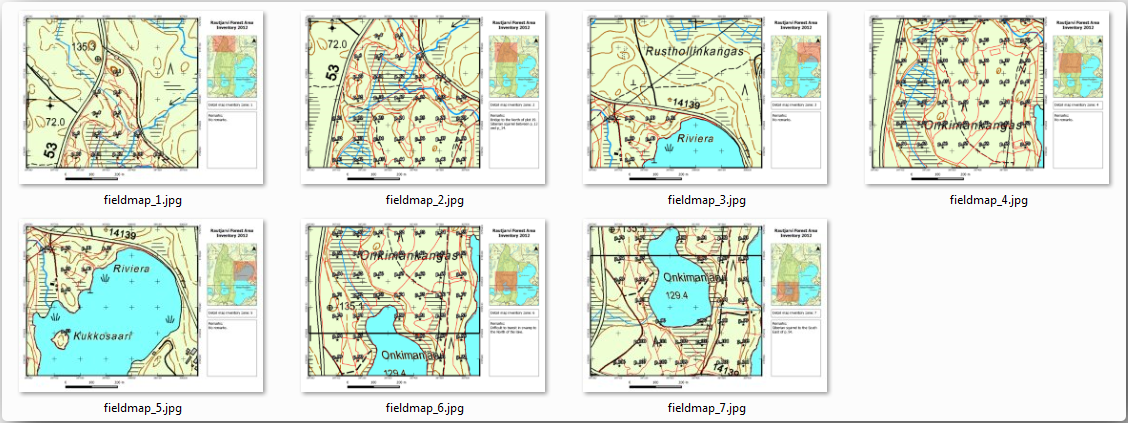
Podrías crear imágenes para cada mapa así de fácil (recuerda desactivar la creación de archivos individuales), aquí puedes ver las miniaturas de las imágenes que serían creadas:
In the Print Layout, press
 Save in order
to save your print layout changes in the project. This also saves the project file.
You can reopen the project at any time and run or edit the atlas.
Save in order
to save your print layout changes in the project. This also saves the project file.
You can reopen the project at any time and run or edit the atlas.It is also possible to save your map as a layout template as
forestry_atlas.qptin yourexercise_data\forestry\map_creation\folder. Use . You will be able to use this template again and again in other projects.Close the Print Layout and the project.
14.6.10. In Conclusion
Te las has arreglado para crear un mapa de plantilla que puede ser utilizado para generar automáticamente mapas detallados para ser utilizados para ayudar a navegar hasta las diferentes parcelas. Como observaste, no fué una tarea fácil pero el beneficio vendrá cuando necesites crear mapas similares para otras regiones utilizando la plantilla que acabas de guardar.
14.6.11. What’s Next?
In the next lesson, you will see how you can use LiDAR data to create a DEM and then use it to enhance your data and maps visibility.


