15.6. Lesson: Creating Detailed Maps with the Atlas Tool
The systematic sampling design is ready and the field teams have loaded the GPS coordinates in their navigation devices. They also have a field data form where they will collect the information measured at every sample plot. To easier find their way to every sample plot, they have requested a number of detail maps where some ground information can be clearly seen along with a smaller subset of sample plots and some information about the map area. You can use the Atlas tool to automatically generate a number of maps with a common format.
The goal for this lesson: Learn to use the Atlas tool in QGIS to generate detailed printable maps to assist in the field inventory work.
15.6.1.  Follow Along: Preparing the Print Layout
Before we can automate the detailed maps of the forest area and our sampling plots, we need to create a map template with all the elements we consider useful for the field work. Of course the most important will be a properly styled but, as you have seen before, you will also need to add lots of other elements that complete the printed map.
Open the QGIS project from the previous lesson forest_inventory.qgs. You should have at least the following layers:
forest_stands_2012 (with a 50% transparency, green fill and darker green border lines).
systematic_plots_clip.
rautjarvi_aerial.
Save the project with a new name, map_creation.qgs.
To create a printable map, remember that you use the Layout Manager:
Open .
In the Layout manager dialog.
Click the Add button and name your print layout forest_map.
Click OK.
Click the Show button.
Set up the printer options so that your maps will suit your paper and margins, for an A4 paper:
Open menuselection:Layout –> Page Setup….
Size is A4 (217 x 297 mm).
Orientation is Landscape.
Margins (millimeters) are all set to 5.
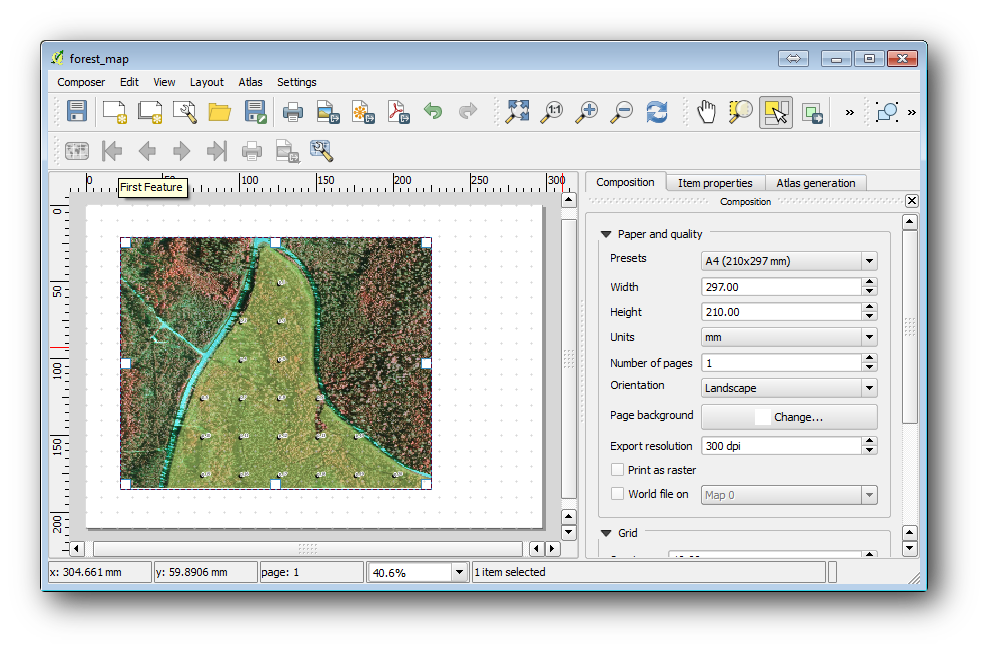
In the Print Layout window, go to the Composition tab (on the right panel) and make sure that these settings for Paper and quality are the same you defined for the printer:
Size: A4 (210x297mm).
Orientation: Landscape.
Quality: 300dpi.
Composing a map is easier if you make use of the canvas grid to position the different elements. Review the settings for the layout grid:
In the Composition tab expand the Grid region.
Check that Spacing is set to 10 mm.
And that Tolerance is set to 2 mm.
You need to activate the use of the grid:
Open the menu.
Check Show grid.
Check Snap to grid.
Notice that options for using guides are checked by default, which allows you to see red guiding lines when you are moving elements in the layout.
Now you can start to add elements to your map canvas. Add first a map element so you can review how it looks as you will be making changes in the layers symbology:
Click on the Add New Map button:
 .
.Click and drag a box on the canvas so that the map occupies most of it.
Notice how the mouse cursor snaps to the canvas grid. Use this function when you add other elements. If you want to have more accuracy, change the grid Spacing setting. If for some reason you don’t want to snap to the grid at some point, you can always check or uncheck it in the menu.
15.6.2. Follow Along: Adding Background Map
Leave the layout open but go back to the map. Lets add some background data and create some styling so that the map content is as clear as possible.
Add the background raster
basic_map.tifthat you can find in theexercise_data\forestry\folder.When prompted select the ETRS89 / ETRS-TM35FIN CRS for the raster.
As you can see the background map is already styled. This type of ready to use cartography raster is very common. It is created from vector data, styled in a standard format and stored as a raster so that you don’t have to bother styling several vector layers and worrying about getting a good result.
Now zoom to your sample plots, so that you can see only about four or five lines of plots.
The current styling of the sample plots is not the best, but how does it look in the print layout?:
While during the last exercises, the white buffer was OK on top of the aerial image, now that the background image is mostly white you barely can see the labels. You can also check how it looks like on the layout:
Go to the Print Layout window.
Use the
 button to select the map element in the layout.
Go to the Item properties tab.
Under Extents click on Set to map canvas extent.
If you need to refresh the element, under Main properties click on the Update preview.
Obviously this is not good enough, you want to make the plot numbers as clearly visible as possible for the field teams.
15.6.3. Try Yourself Changing the Symbology of the Layers
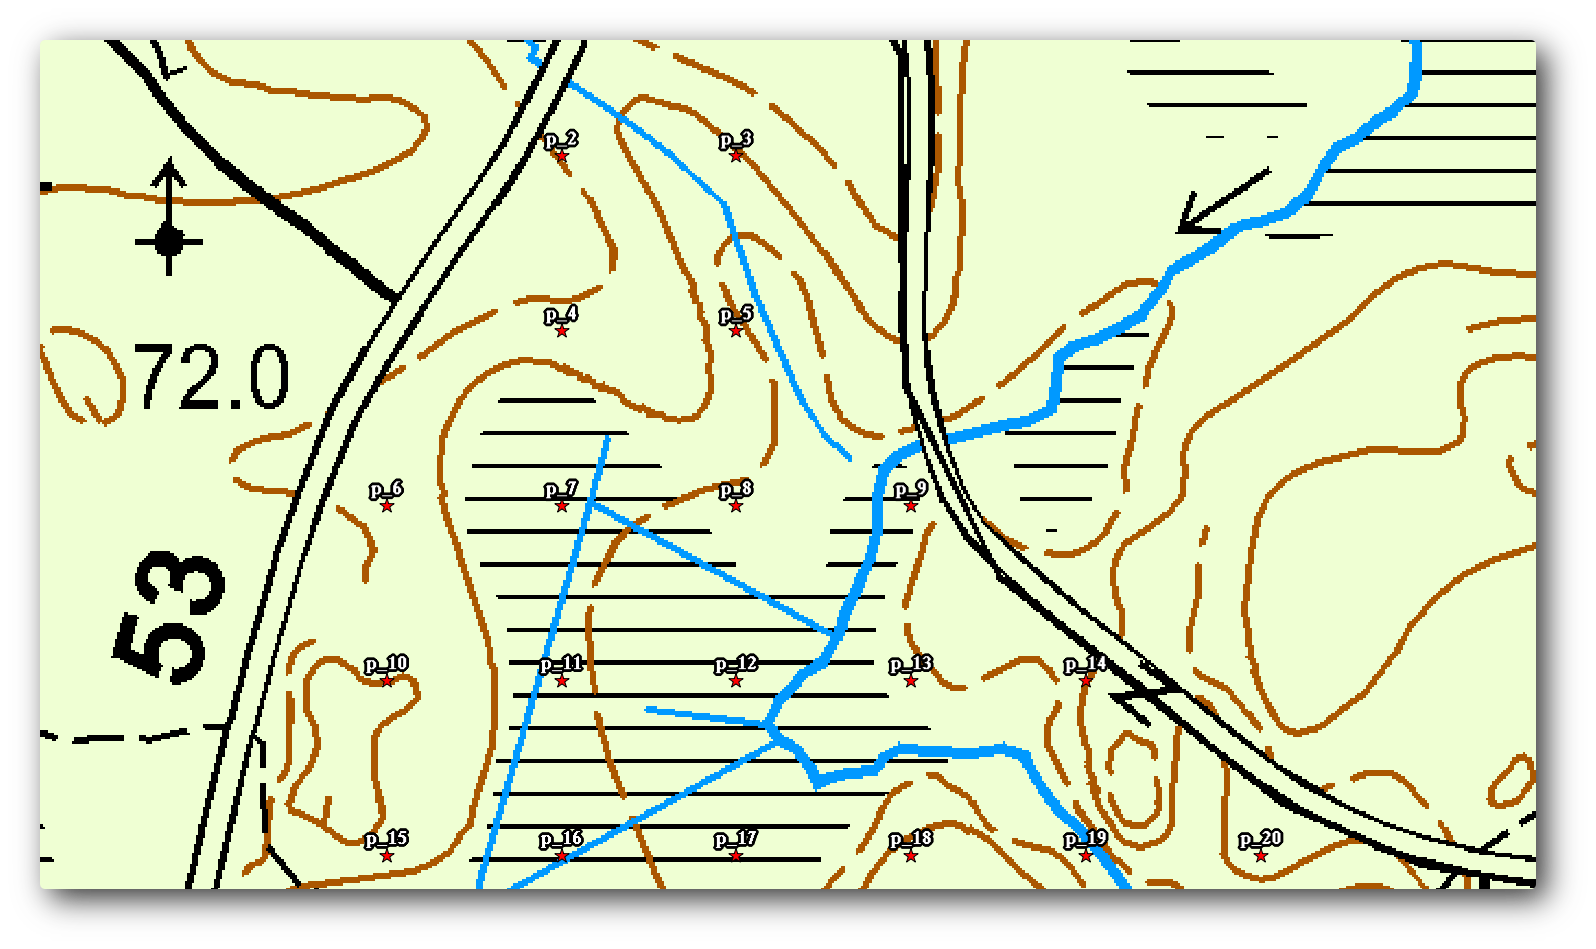
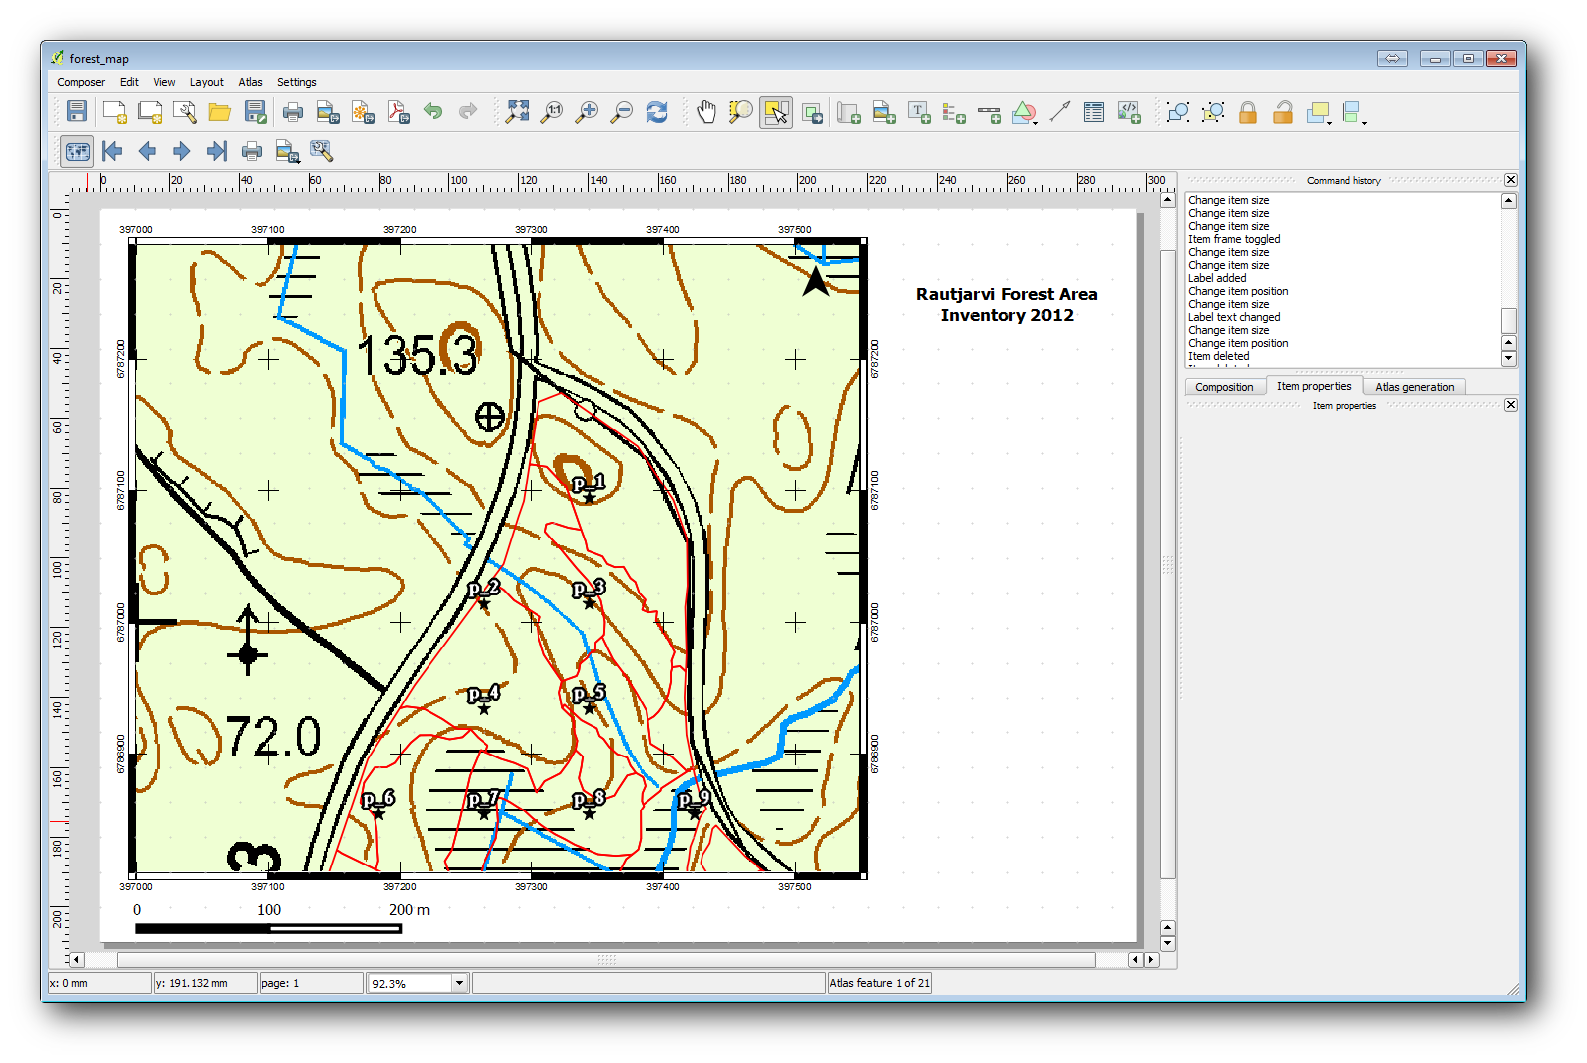
You have been working in Module: Creating a Basic Map with symbology and in Module: Classifying Vector Data with labeling. Go back to those modules if you need to refresh about some of the available options and tools. Your goal is to get the plots locations and their name to be as clearly visible as possible but always allowing to see the background map elements. You can take some guidance from this image:
You will use later the the green styling of the forest_stands_2012 layer. In order to keep it, and have a visualization of it that shows only the stand borders:
Right click on forest_stands_2012 and select Duplicate
you get a new layer named forest_stands_2012 copy that you can use to define a different style, for example with no filling and red borders.
Now you have two different visualizations of the forest stands and you can decide which one to display for your detail map.
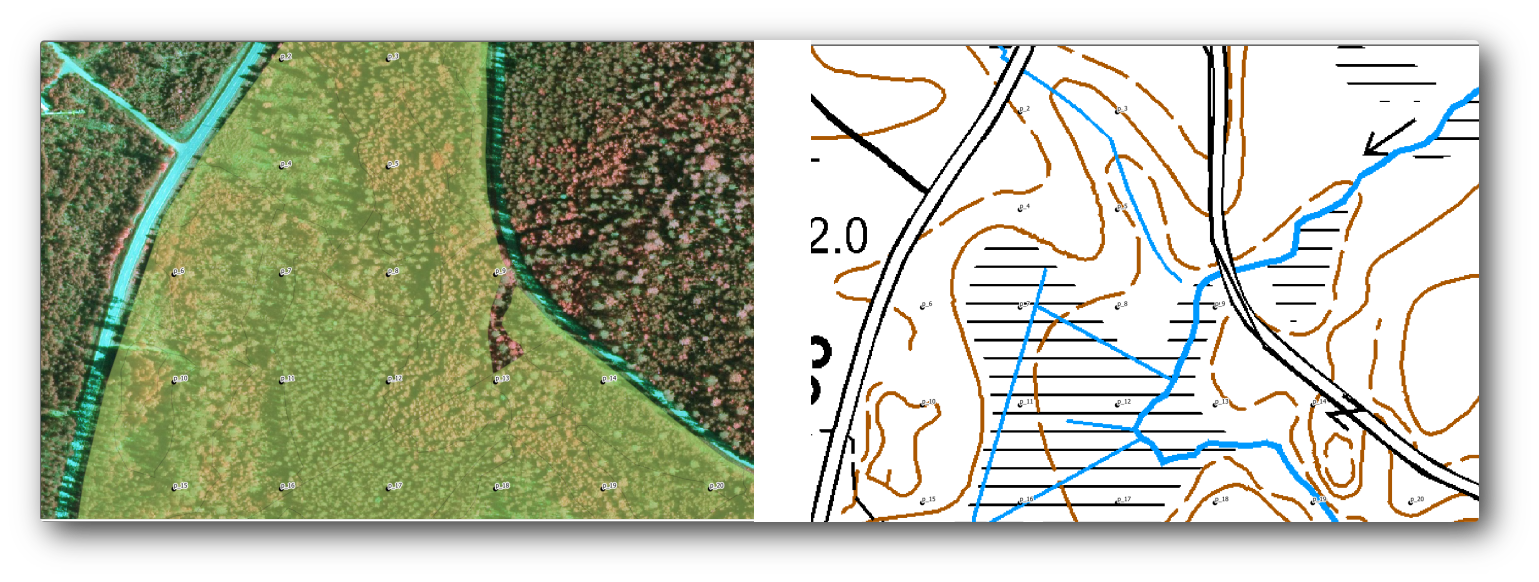
Go back to the Print Layout window often to see what the map would look like. For the purposes of creating detailed maps, you are looking for a symbology that looks good not at the scale of the whole forest area (left image below) but at a closer scale (right image below). Remember to use Update preview and Set to map canvas extent whenever you change the zoom in your map or the layout.
15.6.4. Try Yourself Create a Basic Map Template
Once you have a symbology your happy with, you are ready to add some more information to your printed map. Add at least the following elements:
Title.
A scale bar.
Grid frame for your map.
Coordinates on the sides of the grid.
You have created a similar composition already in Module: Creating Maps. Go back to that module as you need. You can look at this example image for reference:
Export your map as an image and look at it.
.
Use for example the JPG format.
That is what it will look like when printed.
15.6.5. Follow Along: Adding More Elements to the Print Layout
As you probably noticed in the suggested map template images, there are plenty of room on the right side of the canvas. Lets see what else could go in there. For the purposes of our map, a legend is not really necessary, but an overview map and some text boxes could add value to the map.
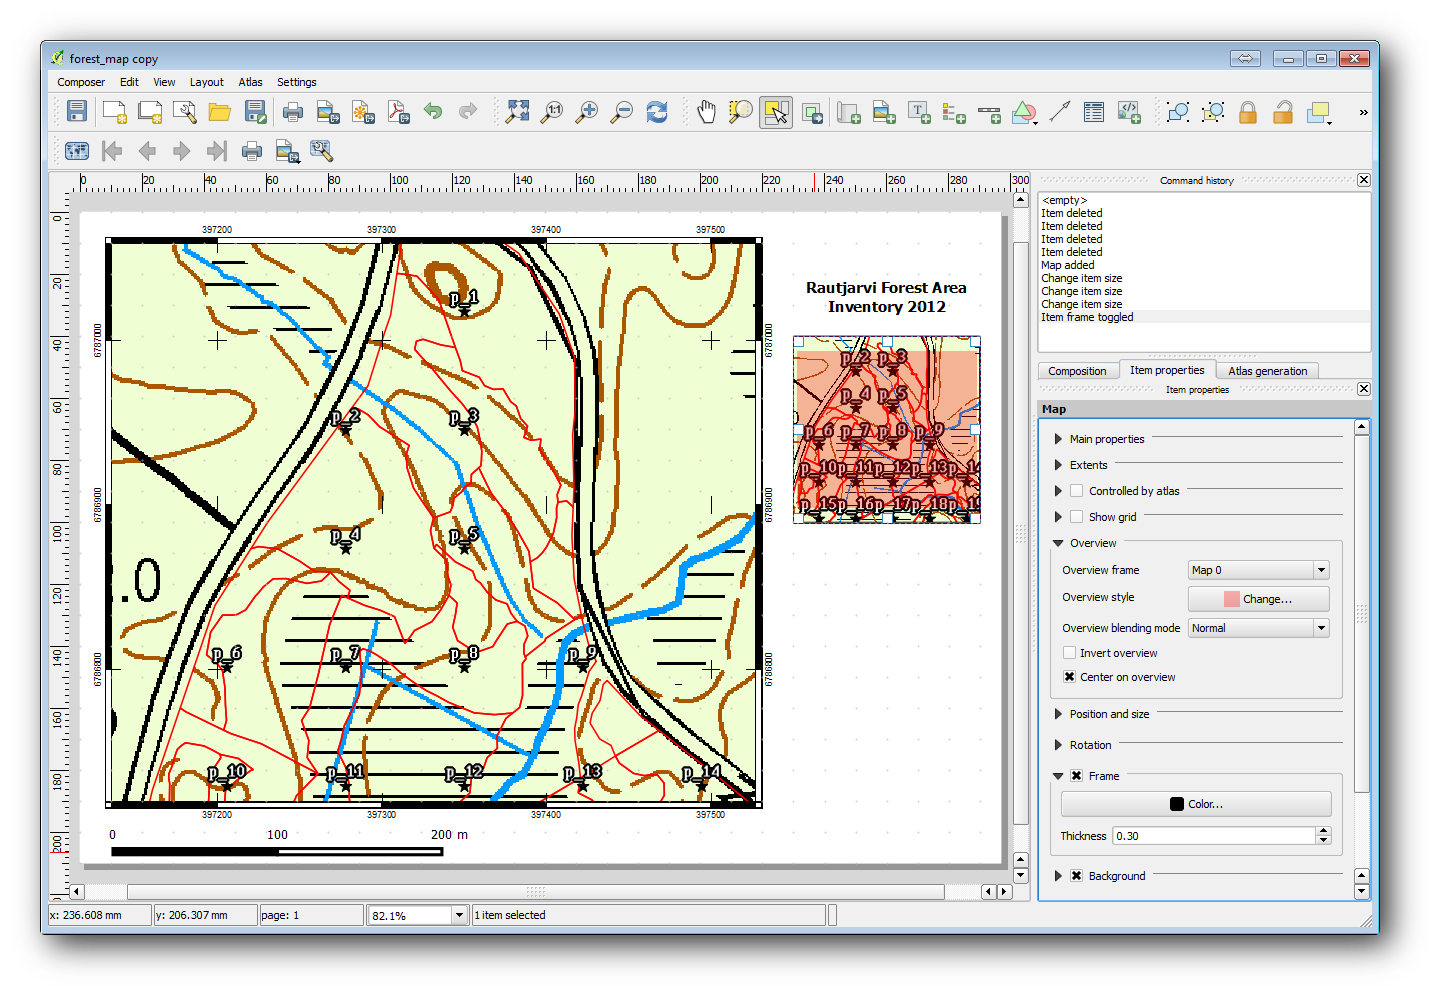
The overview map will help the field teams place the detail map inside the general forest area:
Add another map element to the canvas, right under the title text.
In the Item properties tab, open the Overview dropdown.
Set the Overview frame to Map 0. This creates a shadowed rectangle over the smaller map representing the extent visible in the bigger map.
Check also the Frame option with a black color and a Thickness of 0.30.
Notice that your overview map is not really giving an overview of the forest
area which is what you want. You want this map to represent the whole forest
area and you want it to show only the background map and the
forest_stands_2012 layer, and not display the sample plots. And also
you want to lock its view so it does not change anymore whenever you change
the visibility or order of the layers.
Go back to the map, but don’t close the Print Layout.
Right click the forest_stands_2012 layer and click on Zoom to Layer Extent.
Deactivate all layers except for basic_map and forest_stands_2012.
Go back to the Print Layout.
With the small map selected, click the Set to map canvas extent to set its extents to what you can see in the map window.
Lock the view for the overview map by checking Lock layers for map item under Main properties.
Now your overview map is more what you expected and its view will not change anymore. But, of course, now your detail map is not showing anymore the stand borders nor the sample plots. Lets fix that:
Go to the map window again and select the layers you want to be visible (systematic_plots_clip, forest_stands_2012 copy and Basic_map).
Zoom again to have only a few lines of sample plots visible.
Go back to the Print Layout window.
Select the bigger map in your layout (
).In Item properties click on Update preview and Set to map canvas extent.
Notice that only the bigger map is displaying the current map view, and the small overview map is keeping the same view you had when you locked it.
Note also that the overview is showing a shaded frame for the extent shown in the detail map.
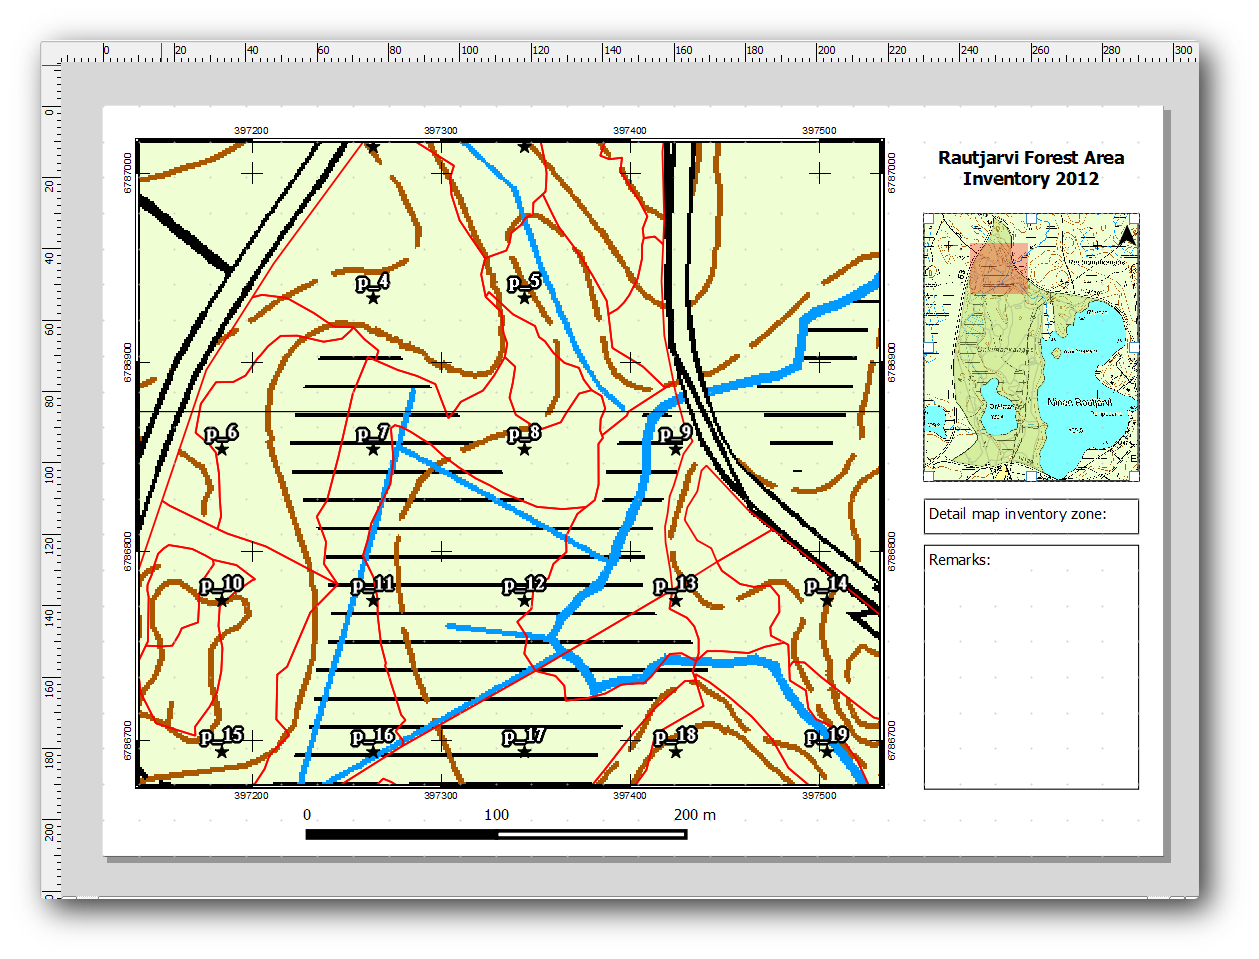
Your template map is almost ready. Add now two text boxes below the map, one containing the text ‘Detailed map zone: ‘ and the other one ‘Remarks: ‘. Place them as you can see in the image above.
You can also add a North arrow to the overview map:
Use the Add image tool,
 .
.Click at the upper right corner of the overview map.
In Item properties open Search directories and browse for an arrow image.
Under Image rotation, check the Sync with map and select Map 1 (the overview map).
Uncheck Background.
Resize the arrow image to a size that looks good on the small map.
The basic map layout is ready, now you want to make use of the Atlas tool to generate as many detail maps in this format as you consider necessary.
15.6.6. Follow Along: Creating an Atlas Coverage
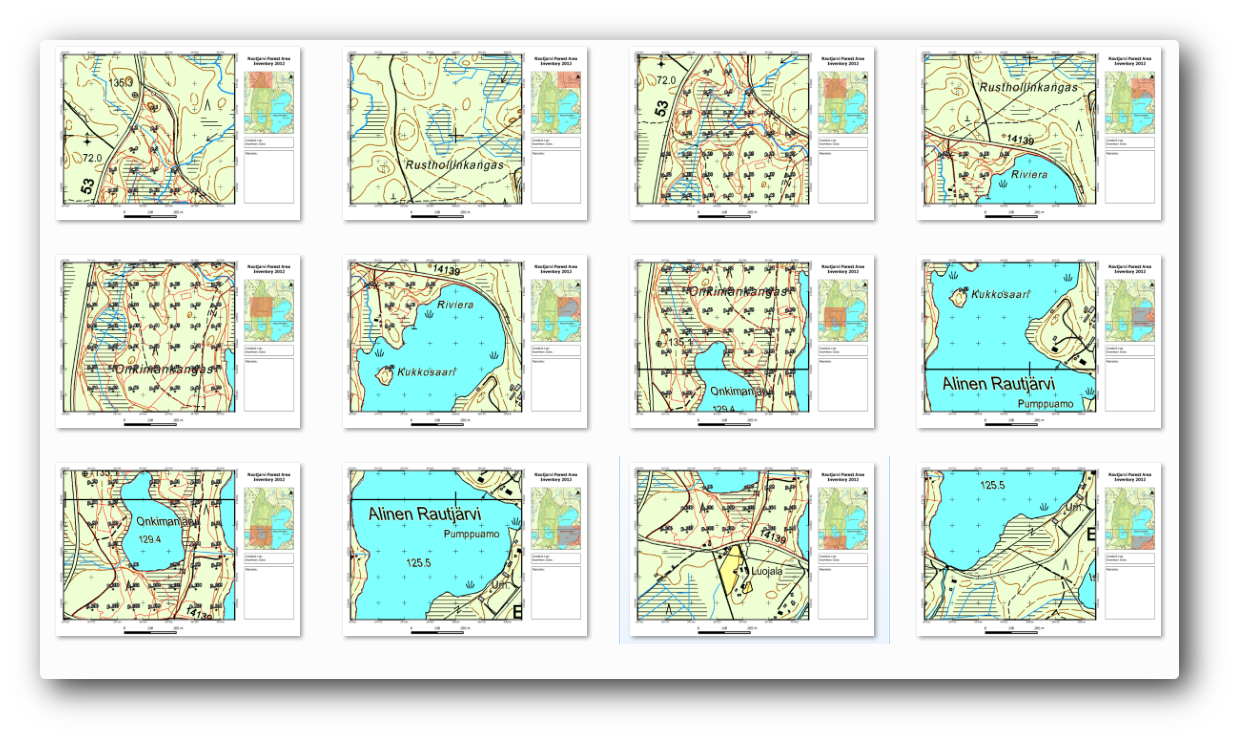
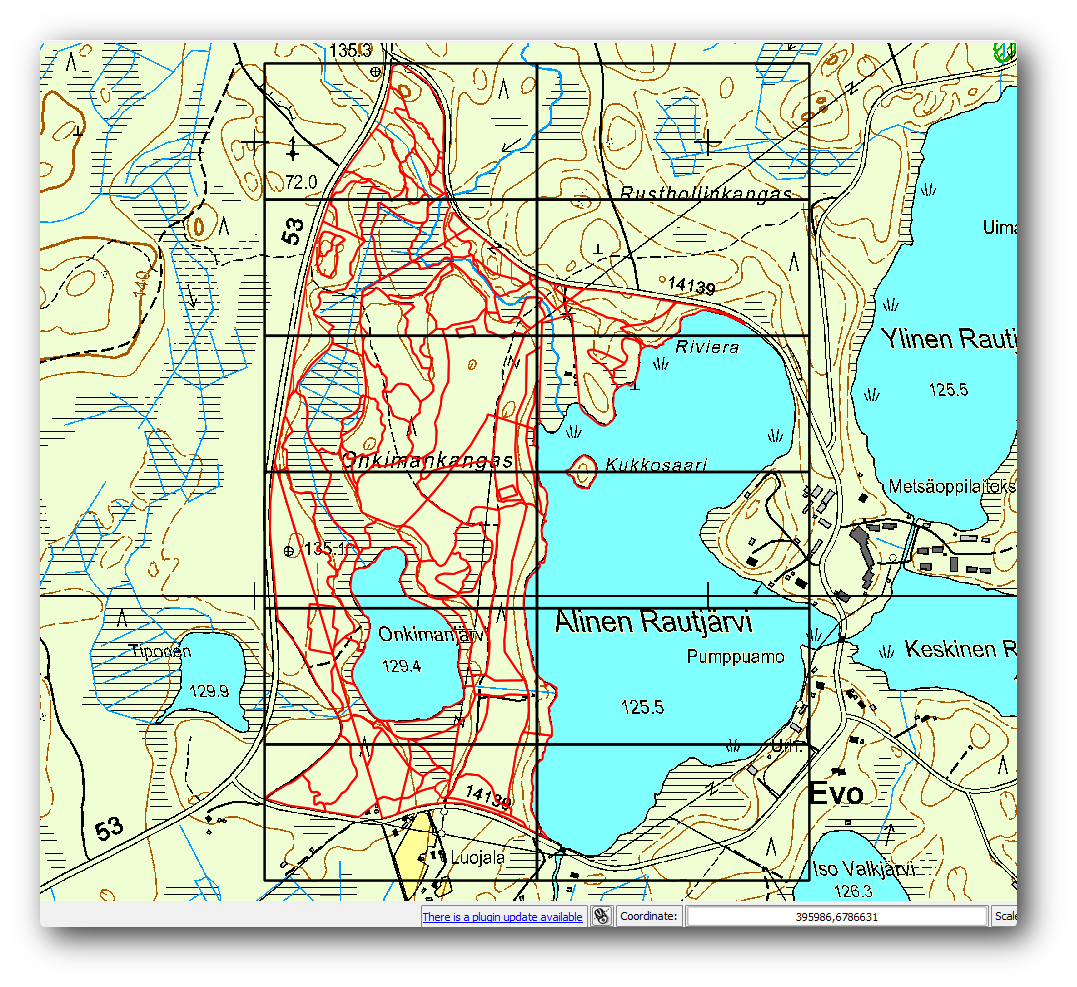
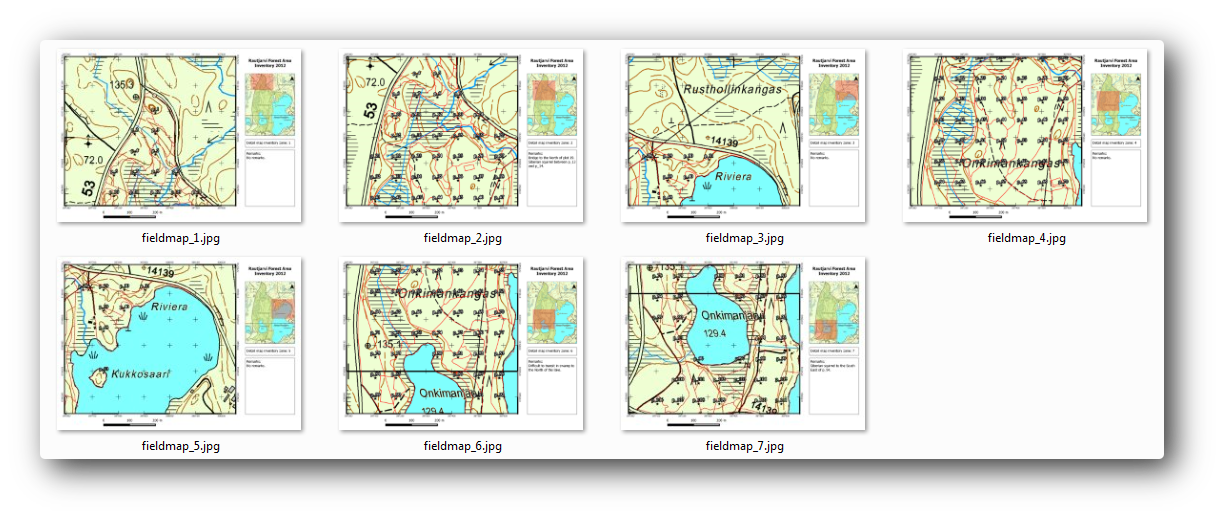
The Atlas coverage is just a vector layer that will be used to generate the detail maps, one map for every feature in the coverage. To get an idea of what you will do next, here is a full set of detail maps for the forest area:
The coverage could be any existing layer, but usually it makes more sense to create one for the specific purpose. Let’s create a grid of polygons covering the forest area:
In the QGIS map view, open .
Set the tool as shown in this image:
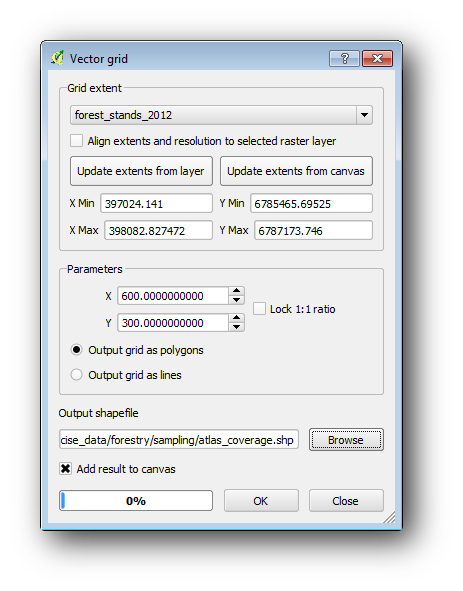
Save the output as atlas_coverage.shp.
Style the new atlas_coverage layer so that the polygons have no filling.
The new polygons are covering the whole forest area and they give you an idea of what each map (created from each polygon) will contain.
15.6.7. Follow Along: Setting Up the Atlas Tool
The last step is to set up the Atlas tool:
Go back to the Print Layout.
In the panel on the right, go to the Atlas generation tab.
Set the options as follows:
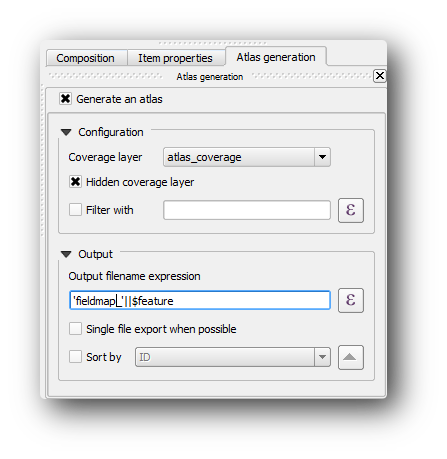
That tells the Atlas tool to use the features (polygons) inside
atlas_coverage as the focus for every detail map. It will output one
map for every feature in the layer. The Hidden coverage layer tells
the Atlas to not show the polygons in the output maps.
One more thing needs to be done. You need to tell the Atlas tool what map element is going to be updated for every output map. By now, you probably can guess that the map to be changed for every feature is the one you have prepared to contain detail views of the sample plots, that is the bigger map element in your canvas:
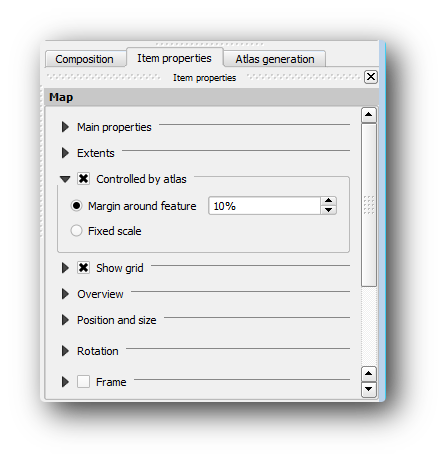
Select the bigger map element.
Go to the Item properties tab.
In the list, check Controlled by atlas.
And set the Marging around feature to 10%. The view extent will be 10% bigger than the polygons, which means that your detail maps will have a 10% overlap.
Now you can use the preview tool for Atlas maps to review what your maps will look like:
Activate the Atlas previews using the button
 or if your Atlas toolbar
is not visible, via .
or if your Atlas toolbar
is not visible, via .You can use the arrows in the Atlas tool bar or in the menu to move through maps that will be created.
Note that some of them cover areas that are not interesting. Lets do something about it and save some trees by not printing those useless maps.
15.6.8. Follow Along: Editing the Coverage Layer
Besides removing the polygons for those areas that are not interesting, you can also customize the text labels in your map to be generated with content from the Attribute table of your coverage layer:
Go back to the map view.
Enable editing for the atlas_coverage layer.
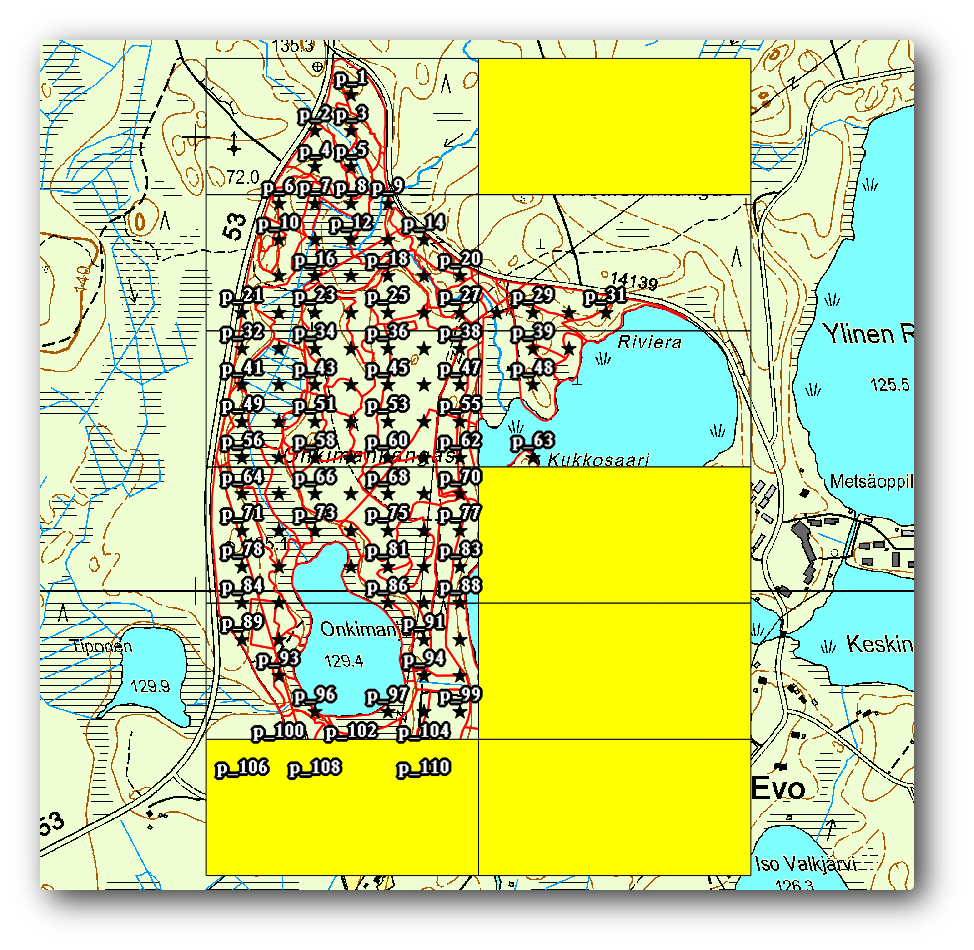
Select the polygons that are selected (in yellow) in the image below.
Remove the selected polygons.
Disable editing and save the edits.
You can go back to the Print Layout and check that the previews of the Atlas use only the polygons you left in the layer.
The coverage layer you are using does not yet have useful information that you could use to customize the content of the labels in your map. The first step is to create them, you can add for example a zone code for the polygon areas and a field with some remarks for the field teams to have into account:
Open the Attribute table for the atlas_coverage layer.
Enable editing.
Use the
 calculator to create and populate the following two fields.
Create a field named Zone and type Whole number (integer).
In the Expression box write/copy/construct $rownum.
Create another field named Remarks, of type Text (string) and a width of 255.
In the Expression box write 'No remarks.'. This will set all the default value for all the polygons.
The forest manager will have some information about the area that might be useful when visiting the area. For example, the existence of a bridge, a swamp or the location of a protected species. The atlas_coverage layer is probably in edit mode still, add the following text in the Remarks field to the corresponding polygons (double click the cell to edit it):
For the Zone 2: Bridge to the North of plot 19. Siberian squirrel between p_13 and p_14..
For the Zone 6: Difficult to transit in swamp to the North of the lake..
For the Zone 7: Siberian squirrel to the South East of p_94..
Disable editing and save your edits.
Almost ready, now you have to tell the Atlas tool that you want some of the text labels to use the information from the atlas_coverage layer’s attribute table.
Go back to the Print Layout.
Select the text label containing Detailed map....
Set the Font size to 12.
Set the cursor at the end of the text in the label.
In the Item properties tab, inside the Main properties click on Insert an expression.
In the Function list double click on the field Zone under Field and Values.
Click OK.
The text inside the box in the Item properties should show Detail map inventory zone: [% "Zone" %]. Note that the [% "Zone" %] will be substituted by the value of the field Zone for the corresponding feature from the layer atlas_coverage.
Test the contents of the label by looking at the different Atlas preview maps.
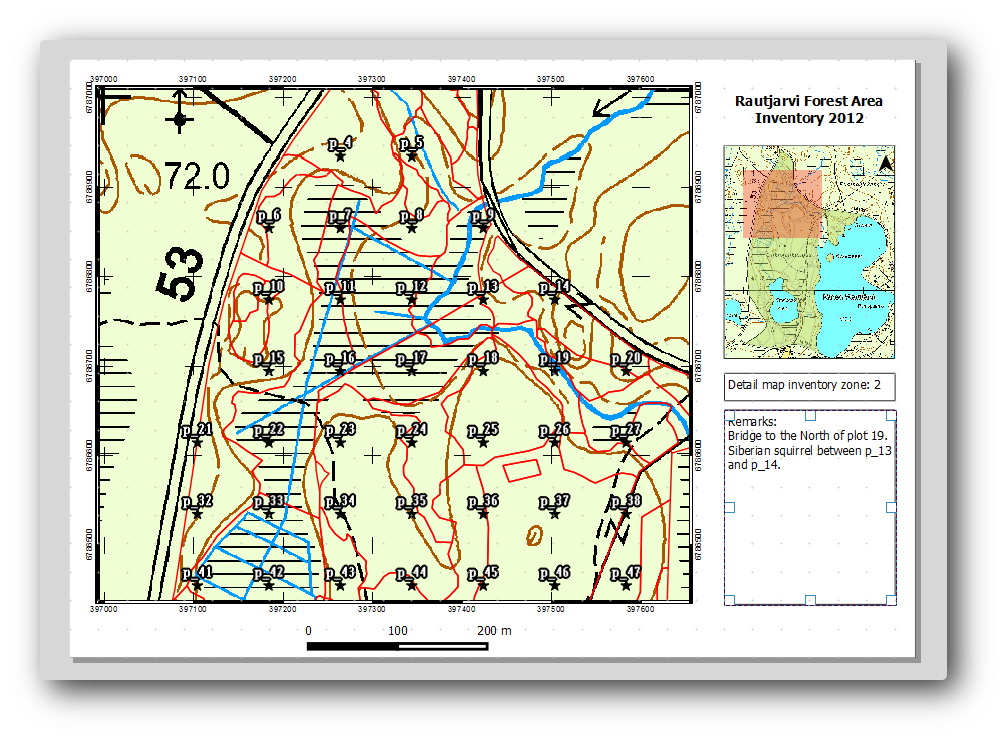
Do the same for the labels with the text Remarks: using the field with the zone information. You can leave a break line before you enter the expression. You can see the result for the preview of zone 2 in the image below:
Use the Atlas preview to browse through all the maps you will be creating soon and enjoy!
15.6.9. Follow Along: Printing the Maps
Last but not least, printing or exporting your maps to image files or PDF files. You can use the or . Currently the SVG export format is not working properly and will give a poor result.
Lets print the maps as a single PDF that you can send to the field office for printing:
Go to the Atlas generation tab on the right panel.
Under the Output check the Single file export when possible. This will put all the maps together into a PDF file, if this option is not checked you will get one file for every map.
Open .
Save the PDF file as inventory_2012_maps.pdf in your exercise_data\forestry\samplig\map_creation\ folder.
Open the PDF file to check that everything went as expected.
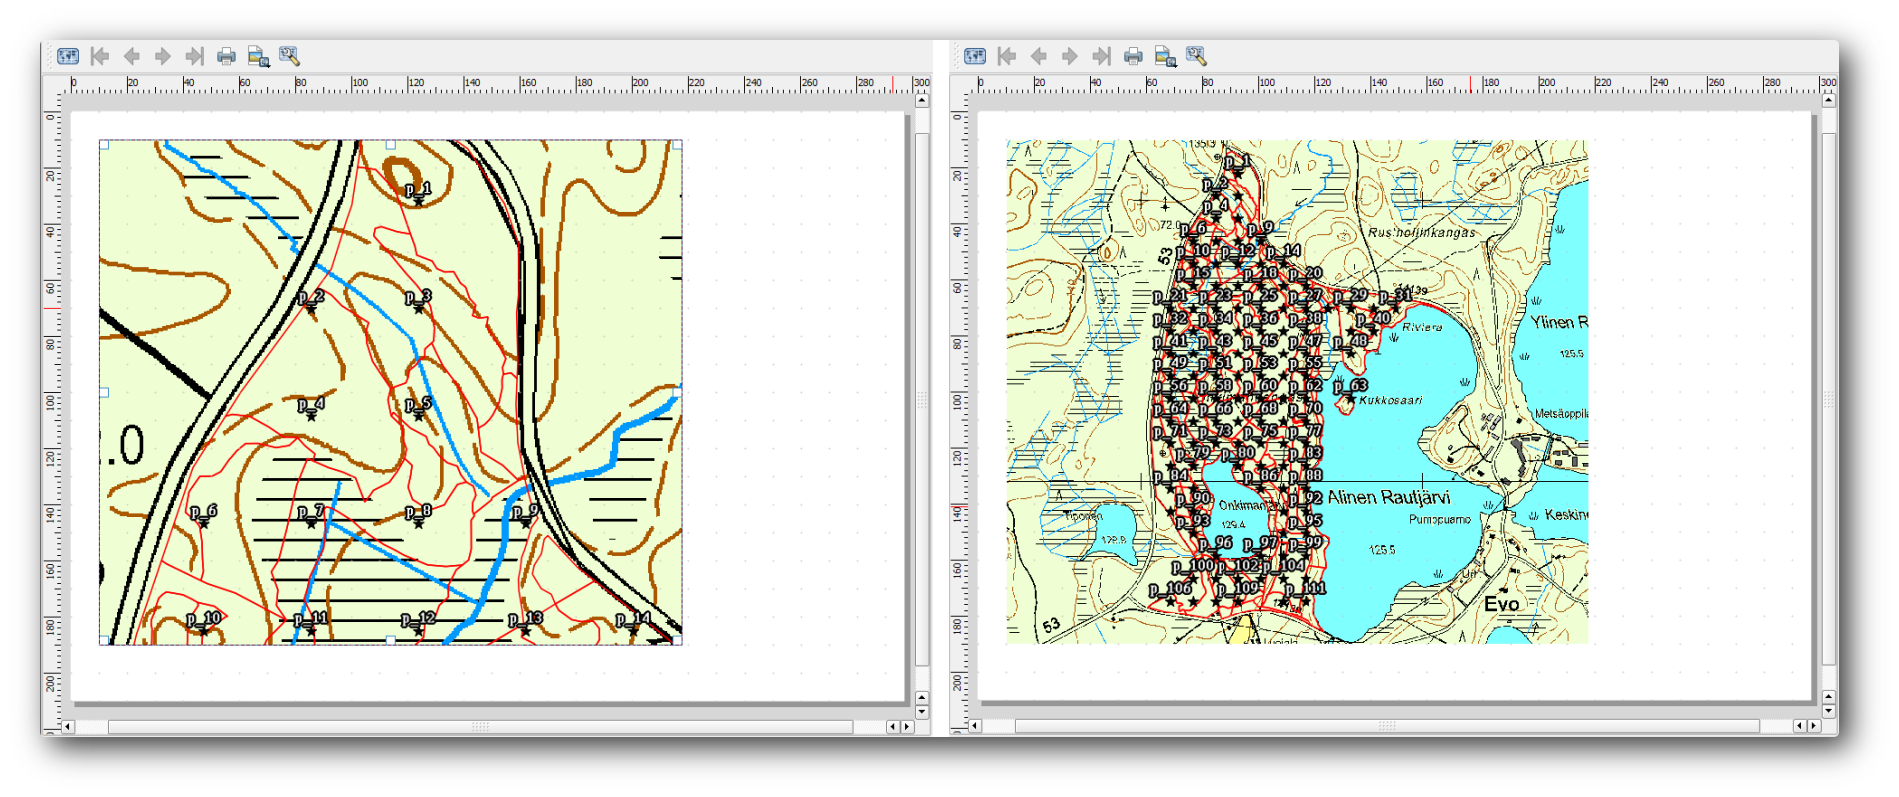
You could just as easily create separate images for every map (remember to uncheck the single file creation), here you can see the thumbnails of the images that would be created:
In the Print Layout, save your map as a layout template as forestry_atlas.qpt in your exercise_data\forestry\map_creation\ folder. Use . You will be able to use this template again and again.
Close the Print Layout and save your QGIS project.
15.6.10. In Conclusion
You have managed to create a template map that can be used to automatically generate detail maps to be used in the field to help navigate to the different plots. As you noticed, this was not an easy task but the benefit will come when you need to create similar maps for other regions and you can use the template you just saved.
15.6.11. What’s Next?
In the next lesson, you will see how you can use LiDAR data to create a DEM and then use it to your enhance your data and maps visibility.