10.1. Lesson: Web Mapping Services
A Web Mapping Service (WMS) is a service hosted on a remote server. Similar to a website, you can access it as long as you have a connection to the server. Using QGIS, you can load a WMS directly into your existing map.
From the lesson on plugins, you will remember that it’s possible to load a new raster image from Google, for example. However, this is a once-off transaction: once you have downloaded the image, it doesn’t change. A WMS is different in that it’s a live service that will automatically refresh its view if you pan or zoom on the map.
The goal for this lesson: To use a WMS and understand its limitations.
10.1.1.  Follow Along: Loading a WMS Layer
For this exercise, you can either use the basic map you made at the start of the course, or just start a new map and load some existing layers into it. For this example, we used a new map and loaded the original places, landuse and protected_areas layers and adjusted the symbology:
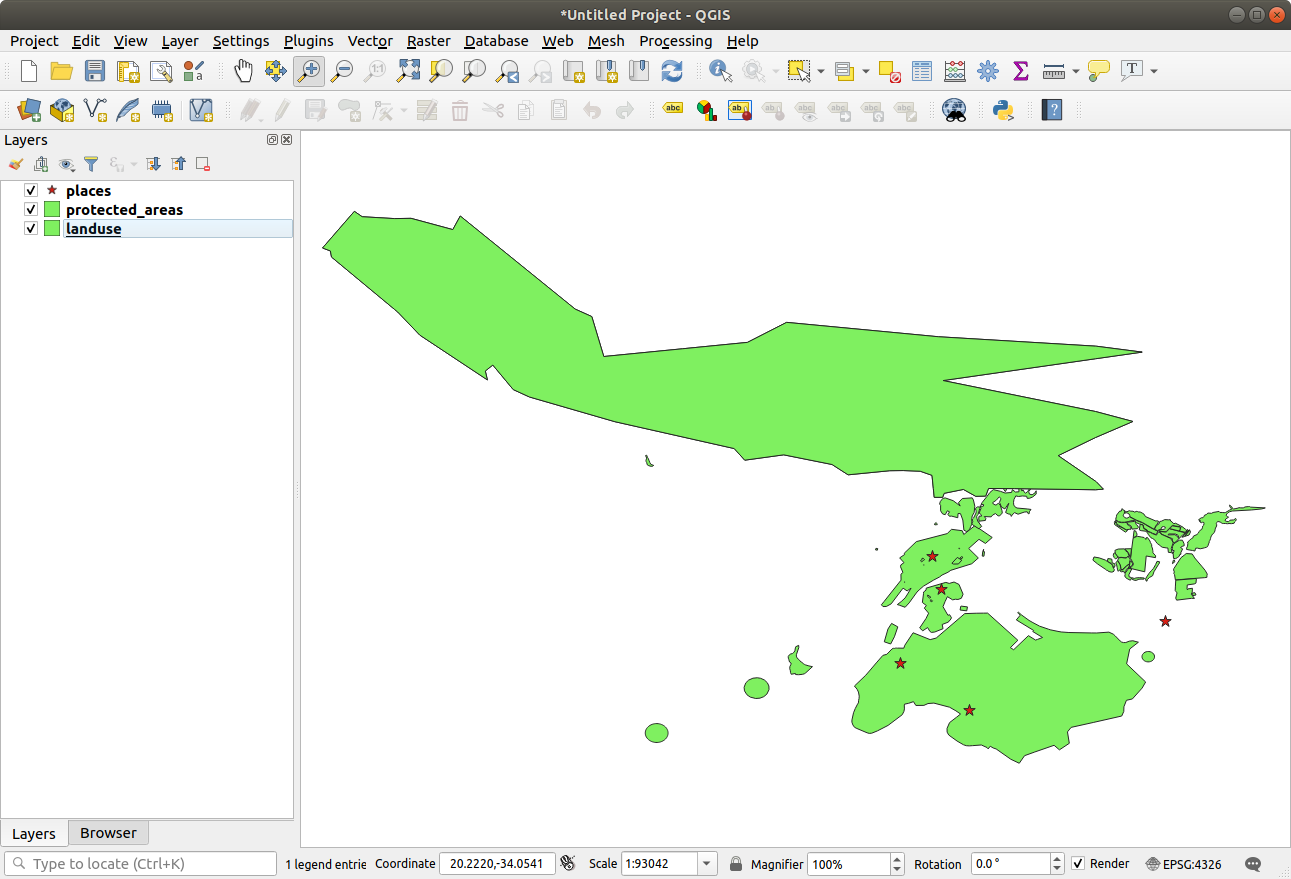
Load these layers into a new map, or use your original map with only these layers visible.
Before starting to add the WMS layer, deactivate “on the fly” projection ( tab, check No projection (or unknown/non-Earth projection). This may cause the layers to no longer overlap properly, but don’t worry: we’ll fix that later.
To add WMS layers, click on the
 button to open the
Data Source Manager dialog and enable the
button to open the
Data Source Manager dialog and enable the  WMS/WMTS tab.
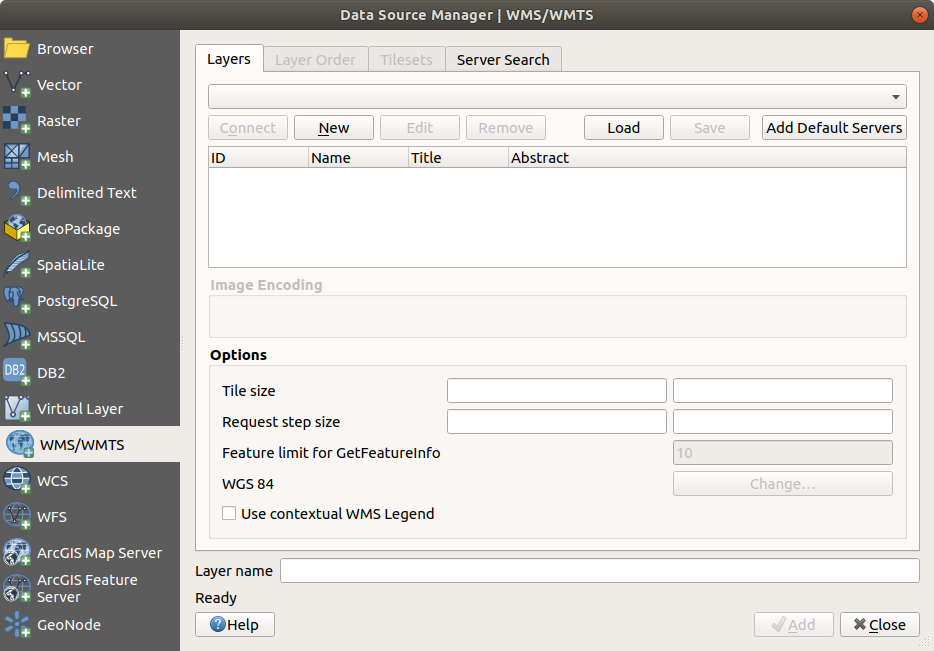
Remember how you connected to a SpatiaLite or GeoPackage database at the beginning of the course. The landuse, buildings, and roads layers are stored in a database. To use those layers, you first needed to connect to the database. Using a WMS is similar, with the exception that the layers are on a remote server.
To create a new connection to a WMS, click on the New button.
You’ll need a WMS address to continue. There are several free WMS servers available on the Internet. One of these is terrestris, which makes use of the OpenStreetMap dataset.
To make use of this WMS, set it up in your current dialog, like this:
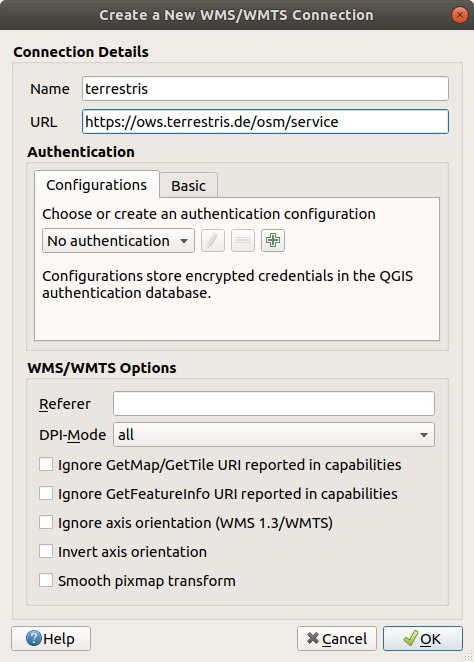
The value of the Name field should be
terrestris.The value of the URL field should be
https://ows.terrestris.de/osm/service.
Click OK. You should see the new WMS server listed:
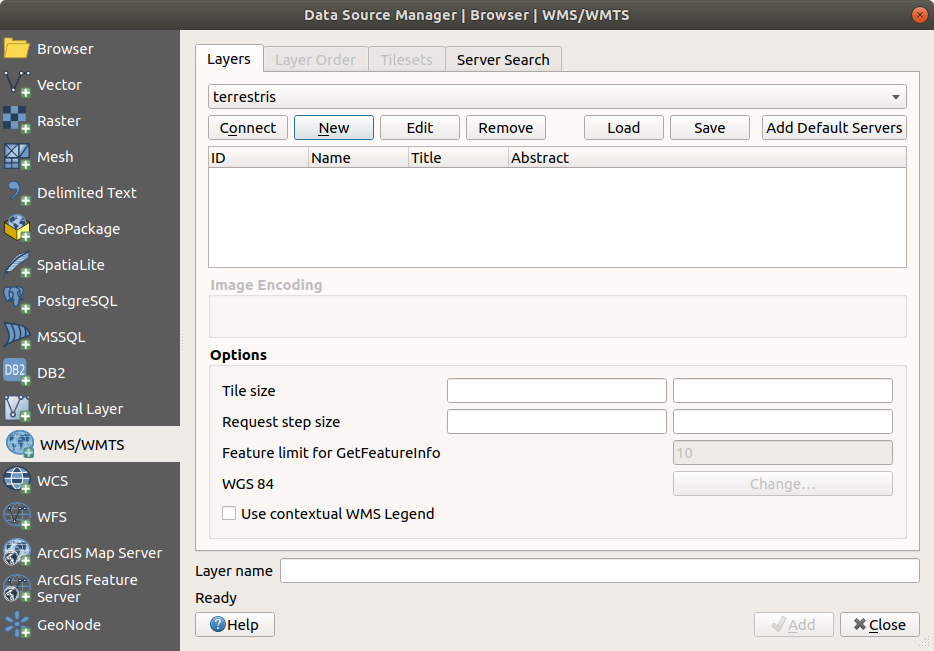
Click Connect. In the list below, you should now see these new entries loaded:
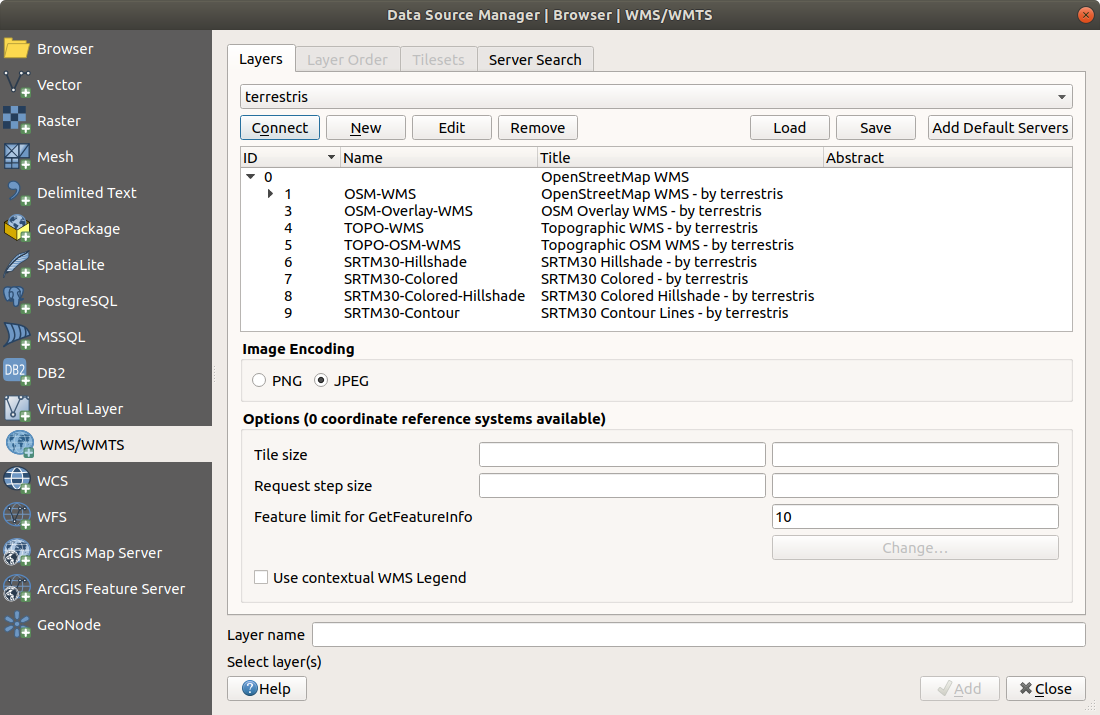
These are all the layers hosted by this WMS server.
Click once on the OSM-WMS layer. This will display its Coordinate Reference System:
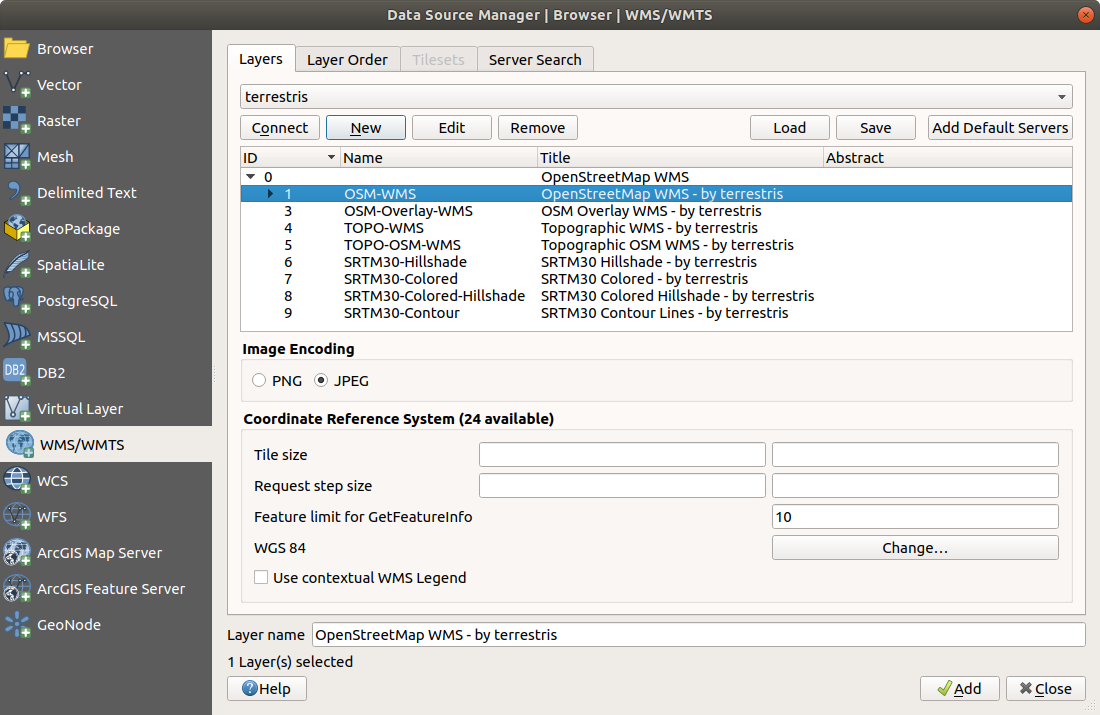
Since we’re not using
WGS 84for our map, let’s see all the CRSs we have to choose from.Click the Change… button. You will see a standard Coordinate Reference System Selector dialog.
We want a projected CRS, so let’s choose WGS 84 / Pseudo Mercator.
Enter the value
pseudoin the Filter field:Choose WGS 84 / Pseudo Mercator from the list.

Click OK. The Coordinate Reference System associated with the entry has changed.
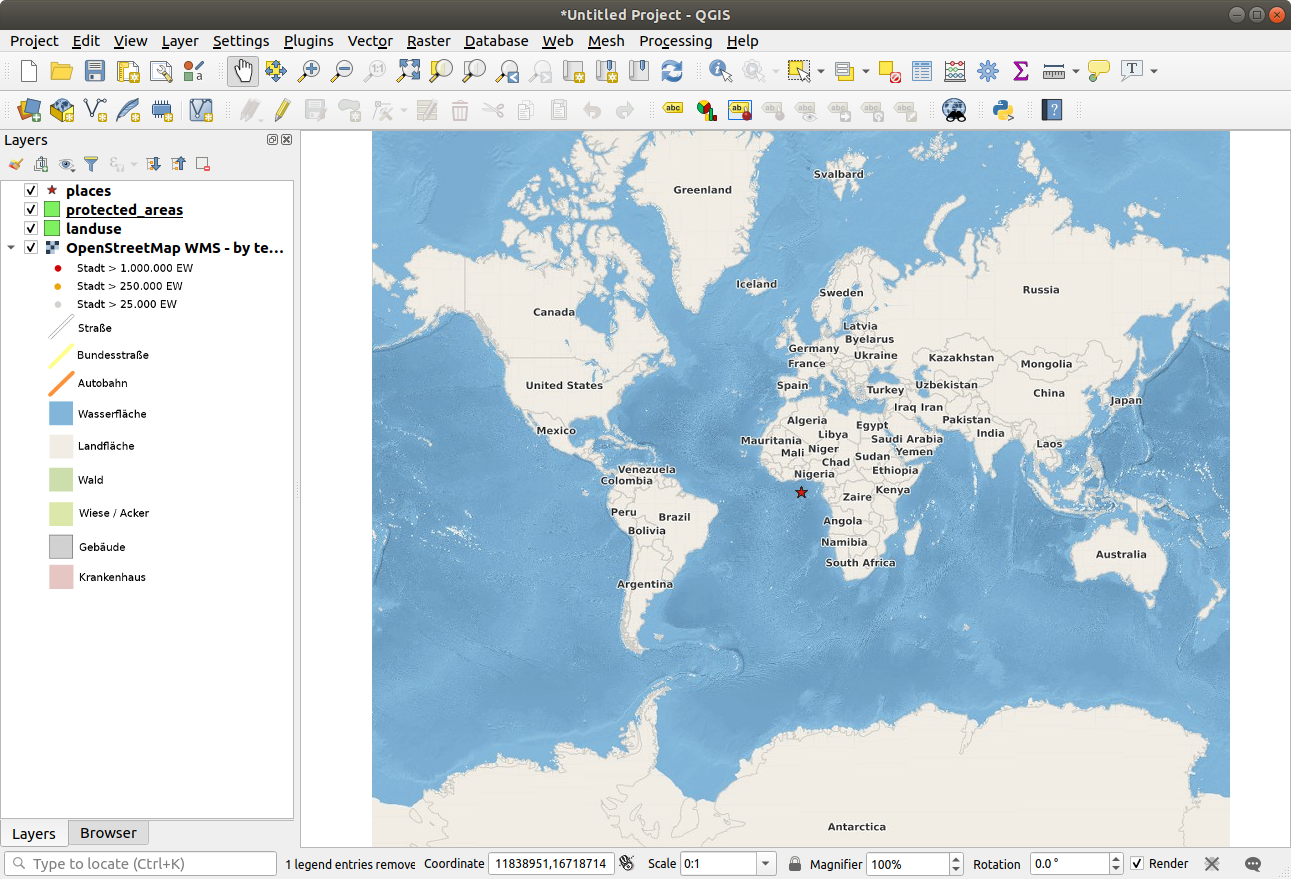
Click Add and the new layer will appear in your map as OpenStreetMap WMS - by terrestris.
Close the Data Source Manager dialog if not done automatically
In the Layers panel, click and drag it to the bottom of the list.
Zoom out in order to get a global view of the layers. You will notice that your layers aren’t located correctly (near west of Africa). This is because “on the fly” projection is disabled.
Let’s enable the reprojection again, but using the same projection as the OpenStreetMap WMS layer, which is WGS 84 / Pseudo Mercator.
Open the tab
Uncheck No projection (or unknown/non-Earth projection)
Choose WGS 84 / Pseudo Mercator from the list.

Click OK.
Now right-click on one of your own layers in the Layers panel and click Zoom to layer extent. You should see the Swellendam area:
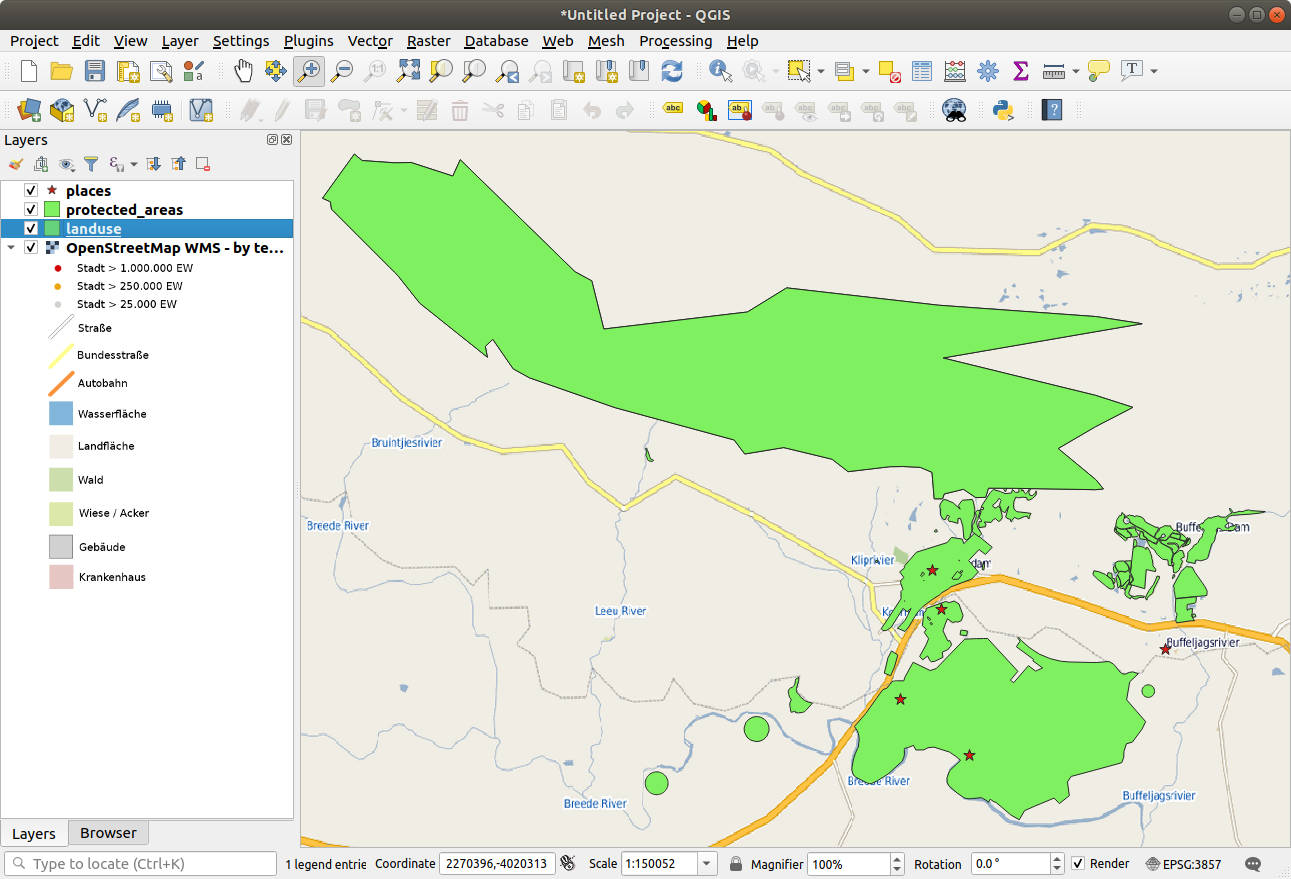
Note how the WMS layer’s streets and our own streets overlap. That’s a good sign!
10.1.1.1. The nature and limitations of WMS
By now you may have noticed that this WMS layer actually has many features in it. It has streets, rivers, nature reserves, and so on. What’s more, even though it looks like it’s made up of vectors, it seems to be a raster, but you can’t change its symbology. Why is that?
This is how a WMS works: it’s a map, similar to a normal map on paper, that you receive as an image. What usually happens is that you have vector layers, which QGIS renders as a map. But using a WMS, those vector layers are on the WMS server, which renders it as a map and sends that map to you as an image. QGIS can display this image, but can’t change its symbology, because all that is handled on the server.
This has several advantages, because you don’t need to worry about the symbology. It’s already worked out, and should be nice to look at on any competently designed WMS.
On the other hand, you can’t change the symbology if you don’t like it, and if things change on the WMS server, then they’ll change on your map as well. This is why you sometimes want to use a Web Feature Service (WFS) instead, which gives you vector layers separately, and not as part of a WMS-style map.
This will be covered in the next lesson, however. First, let’s add another WMS layer from the terrestris WMS server.
10.1.2. Try Yourself
Hide the OSM-WSM layer in the Layers panel.
Add the “ZAF CGS 1M Bedrock Lithostratigraphy” WMS server at this URL:
http://196.33.85.22/cgi-bin/ZAF_CGS_Bedrock_Geology/wmsLoad the BEDROCKGEOLOGY layer into the map (you can also use the
button to open the Data Source Manager dialog).
Remember to check that it’s in the same
WGS 84 / World Mercator projection as the rest of your map!You might want to set its Encoding to JPEG and its Tile size option to
200by200, so that it loads faster:
10.1.3.  Try Yourself
Hide all other WMS layers to prevent them from rendering unnecessarily in the background.
Add the “OGC” WMS server at this URL:
http://ogc.gbif.org:80/wmsAdd the bluemarble layer.
10.1.4.  Try Yourself
Part of the difficulty of using WMS is finding a good (free) server.
Find a new WMS at directory.spatineo.com (or elsewhere online). It must not have associated fees or restrictions, and must have coverage over the Swellendam study area.
Remember that what you need in order to use a WMS is only its URL (and preferably some sort of description).
10.1.5. In Conclusion
Using a WMS, you can add inactive maps as backdrops for your existing map data.
10.1.6. Further Reading
10.1.7. What’s Next?
Now that you’ve added an inactive map as a backdrop, you’ll be glad to know that it’s also possible to add features (such as the other vector layers you added before). Adding features from remote servers is possible by using a Web Feature Service (WFS). That’s the topic of the next lesson.