Wichtig
Übersetzen ist eine Gemeinschaftsarbeit Sie können mitmachen 1. Diese Seite befindet sich derzeit im |Übersetzungsfortschritt|.
2.4. Übung: Symbolisierung
Die Symbolisierung eines Layers ist sein Aussehen auf der Karte. Der wichtigste Vorteil gegenüber anderen Methoden zur Darstellung von gegografischen Daten besteht darin, dass Sie mit GIS eine dynamische visuelle Darstellung der Daten haben, mit denen sie arbeiten.
Daher ist die visuelle Darstellung der Karte (die von der Symbolisierung der inidividuellen Layer abhängt) sehr wichtig. Der Anwender, der Ihre Karten benutzt, soll direkt eindeutig sehen, was die Karte zeigt. Ebenso müssen Sie die Daten untersuchen können, während Sie damit arbeiten. Dabei ist die richtige Symbolisierung von großer Bedeutung.
Mit anderen Worten: Eine gute Symbolisierung ist kein Luxus oder nur schmückendes Beiwerk. Sie ist sogar unerlässlich, um ein GIS richtig zu benutzen, Karten zu erstellen und Informationen bereitzustellen, die Menschen nutzen können.
Das Ziel dieser Lektion: Jede beliebige Symbolisierung erstellen und auf jeden beliebigen Vektorlayer anwenden können.
2.4.1. ★☆☆ Mitmachen: Farben ändern
Um die Symbolisierung eines Layers zu ändern, öffnen Sie dessen Layereigenschaften. Beginnen wir mit dem Ändern der Farbe des `` landuse``-Layers.
Klicken Sie mit der rechten Maustaste auf den Layer
landusein der Layerliste.Wählen Sie den Menüeintrag Eigenschaften… im Kontextmenü aus.
Bemerkung
Standardmäßig können Sie die Layereigenschaften auch per Doppelklick auf den Layer in der Layerliste aufrufen.
Wählen Sie im Fenster Layereigenschaften den Tab
 Symbolisierung:
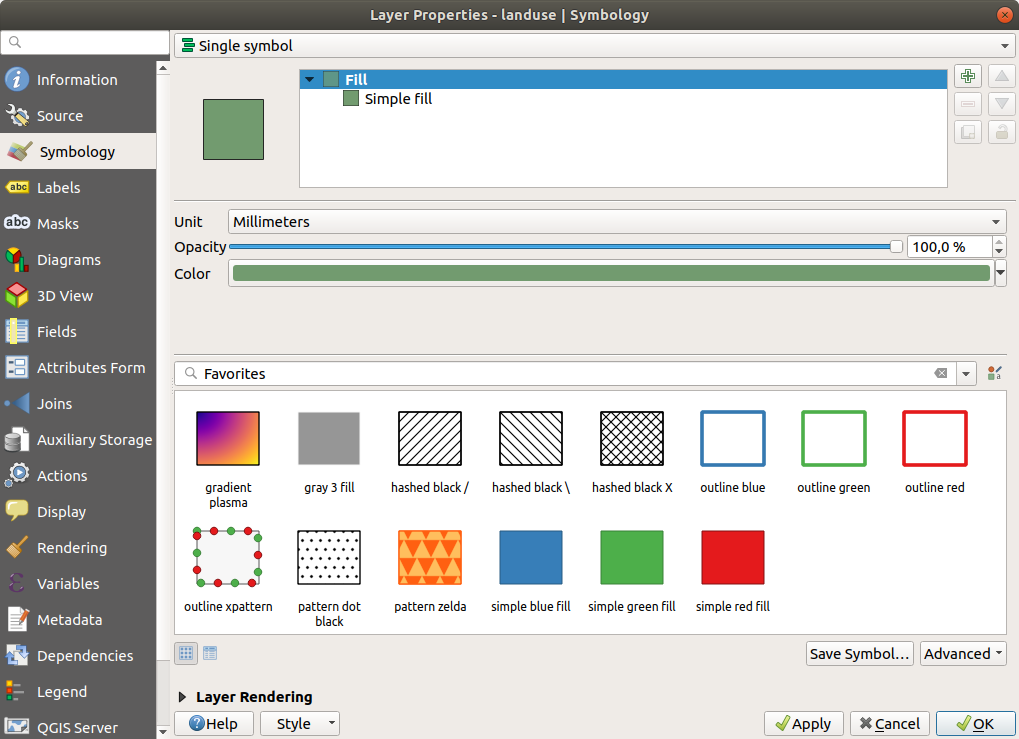
Klicken Sie auf die Farbauswahl-Schaltfläche neben dem Feld Farbe. Ein Standardfarbdialog wird angezeigt.
Wählen Sie eine graue Farbe aus und bestätigen Sie mit OK.
Drücken Sie im Fenster Layereigenschaften erneut OK, und Sie werden sehen, wie die Farbänderung auf den Layer angewandt wird.
2.4.2. ★☆☆ Probieren Sie es selbst:
Ändern Sie die Farbe des water-Layers auf hellblau. Probieren Sie, das Layergestaltungsfenster anstelle des Layereigenschaften-Fensters zu benutzen.
Lösung
Überprüfen Sie, ob sich die Farben wie erwartet verändern.
Es genügt, die Ebene
waterin der Legende zu markieren und dann auf die Schaltfläche Layergestaltungsfenster öffnen` zu klicken. Ändern Sie die Farbe in eine solche, die zum
 water-Layer passt.
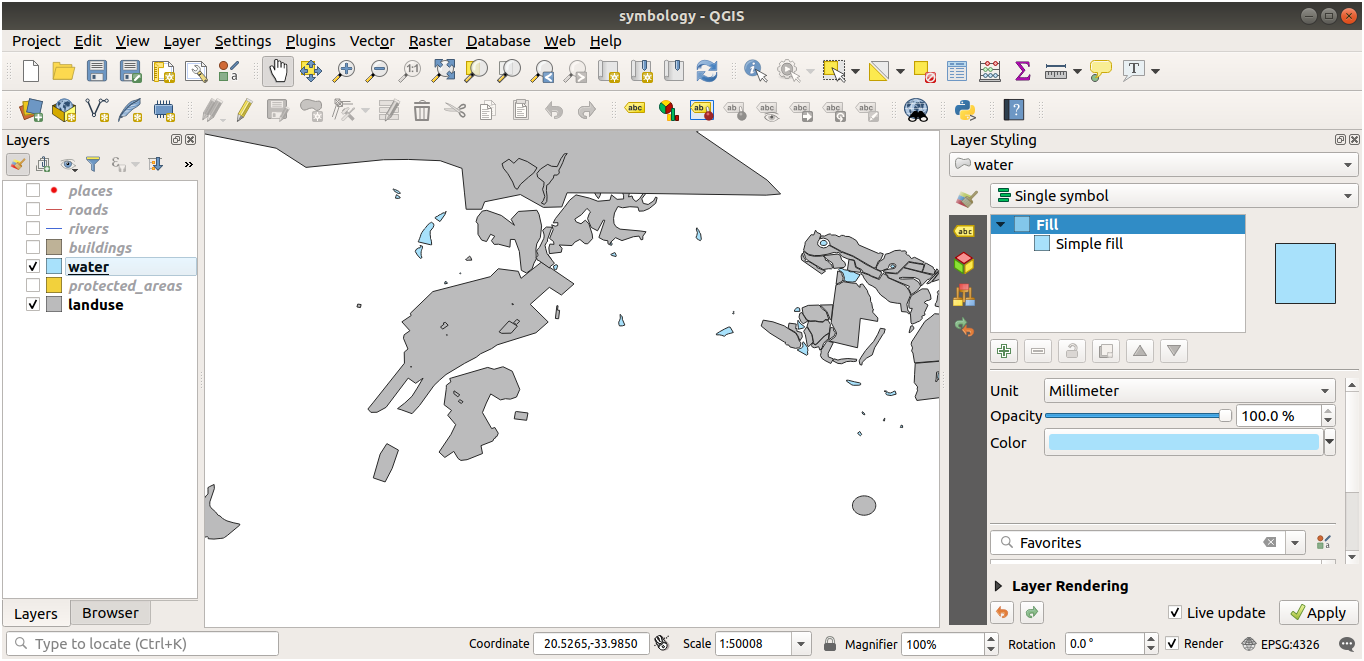
Wenn Sie jeweils nur an einem Layer arbeiten möchten und nicht wollen, dass die anderen Layer Sie ablenken, können Sie einen Layer ausblenden, indem Sie in der Layerliste auf das Kontrollkästchen neben dem Namen des Layers klicken. Wenn das Kästchen nicht ausgefüllt ist, ist der Layer ausgeblendet.
2.4.3. ★☆☆ Mitmachen: Symbolstruktur verändern
Das ist soweit gut, aber zur Symbolisierung eines Layers gehört mehr als nur ihre Farbe. Als Nächstes wollen wir die Linien zwischen den verschiedenen landuse-Gebieten entfernen, um die Karte optisch übersichtlicher zu machen.
Öffnen Sie das Layereigenschaften-Fenster für den
landuse-Layer.Im Tab Symbolisierung sehen Sie die gleiche Art von Dialog wie zuvor. Diesmal geht es jedoch um mehr als nur um das Ändern der Farbe.
Wählen Sie im Dropdown-Menü Füllung des Symbollayerbaums die Option Einfache Füllung aus.
Klicken Sie auf das Dropdown-Menü Strichstil. Im Moment sollte eine kurze Linie und die Worte Durchgezogene Linie angezeigt werden.
Ändern Sie dies in Keine Zeile.
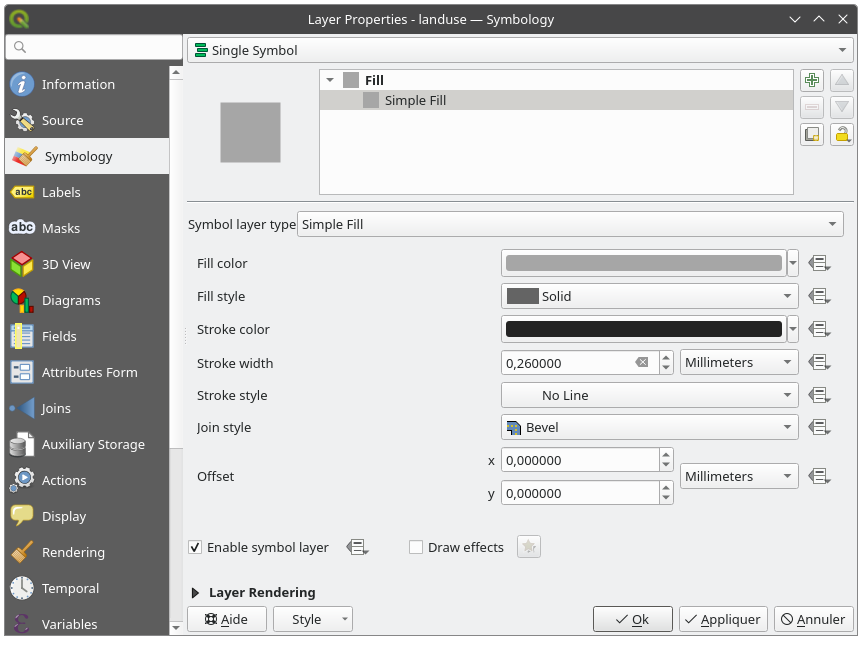
Klicken Sie OK.
Jetzt weist der Layer landuse keine Linien zwischen den Flächen auf.
2.4.4. ★☆☆ Probieren Sie es selbst:
Ändern Sie die Symbologie des
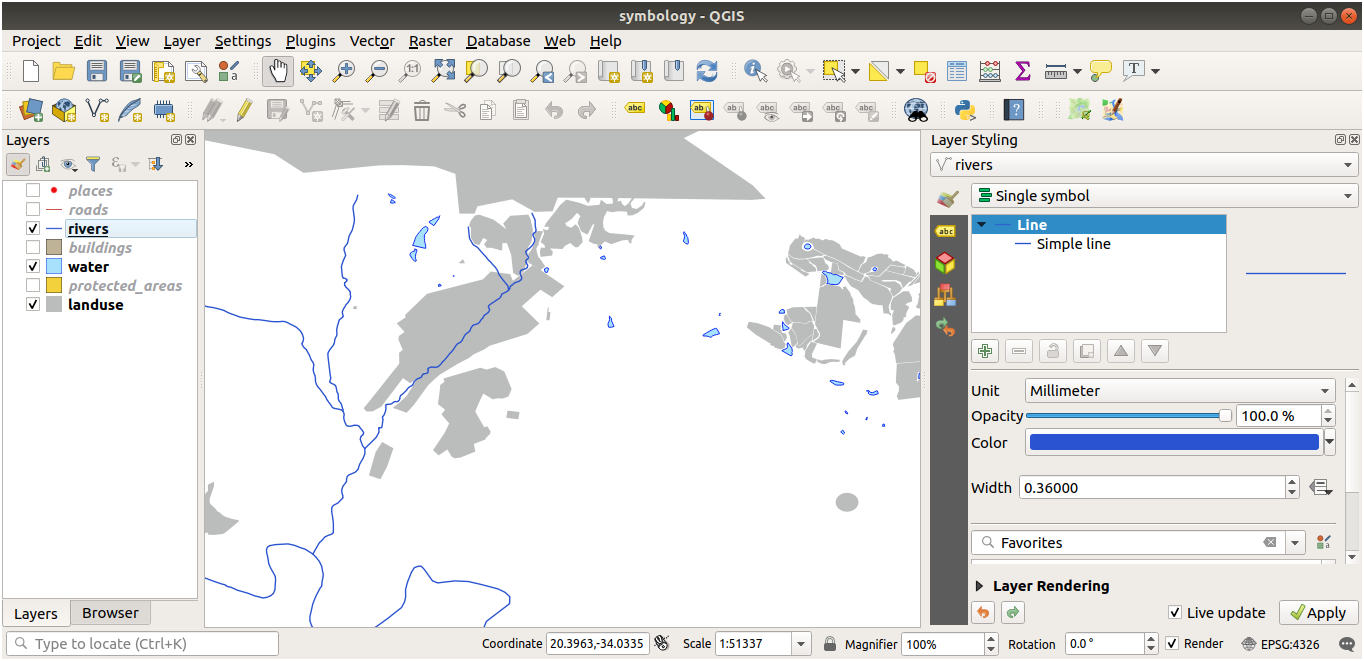
Wasser-Layers erneut, sodass er einen dunkelblauen Umriss hat.Andern Sie die Symbologie des Flüsse`-Layer’s in eine sinnvolle Darstellung der Wasserwege.
Denken Sie daran: Sie können die Schaltfläche  Open the Layer Styling panel verwenden und alle Änderungen sofort sehen. Außerdem können Sie über dieses Bedienfeld auch einzelne Änderungen rückgängig machen, während Sie einen Layer symbolisieren.
Antwort
Ihre Karte sollte nun so aussehen:
Wenn Sie Anfänger sind, können Sie hier aufhören.
Verwenden Sie die oben beschriebene Methode, um die Farben und Stile für alle verbleibenden Layer zu ändern.
Versuchen Sie, natürliche Farben für die Objekte zu verwenden. Eine Straße sollte beispielsweise nicht rot oder blau, sondern grau oder schwarz sein.
Experimentieren Sie auch gerne mit verschiedenen Füllstil und Linienstil Einstellungen für die Polygone.
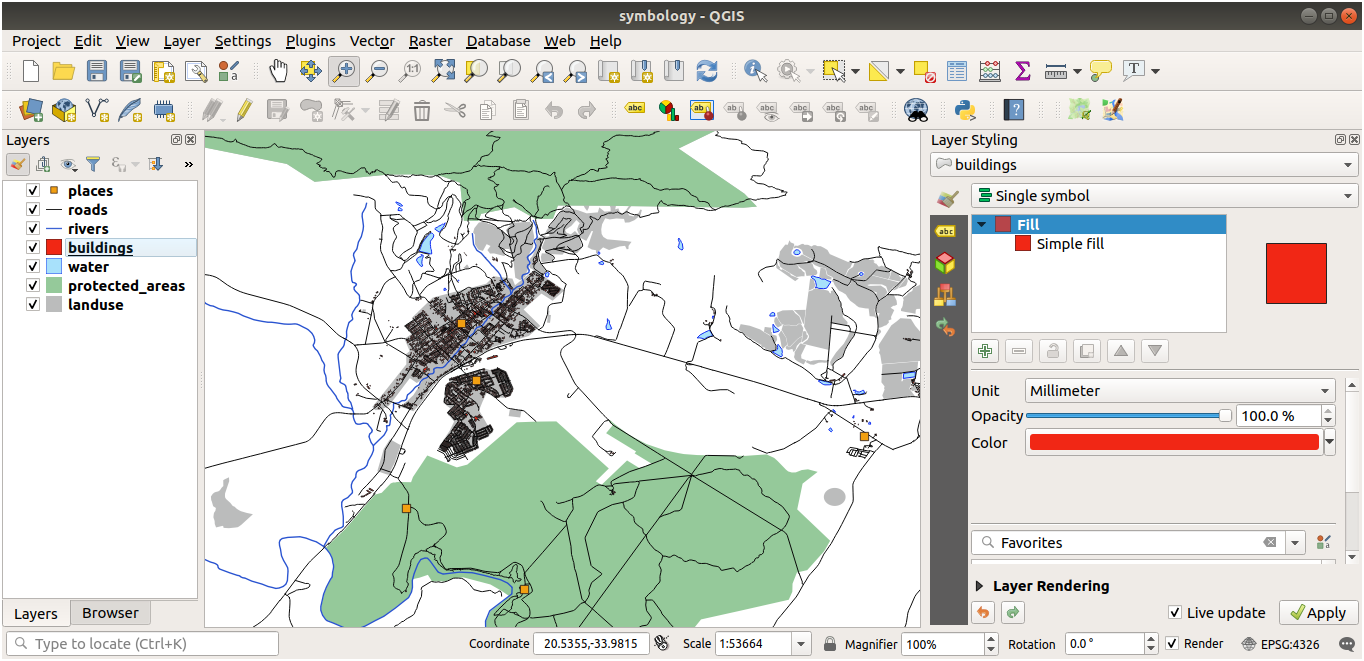
2.4.5. ★★☆ Machen Sie mit: Maßstabsabhängige Sichtbarkeit
Manchmal werden Sie feststellen, dass ein Layer für einen bestimmten Maßstab nicht geeignet ist. Beispielsweise kann ein Datensatz aller Kontinente nur wenige Details aufweisen und auf Straßenebene nicht sehr genau sein. In einem solchen Fall möchten Sie wahrscheinlich den Datensatz bei ungeeigneten Maßstäben ausblenden können.
In unserem Fall können wir uns entscheiden, die Gebäude in kleinen Maßstäben auszublenden. Diese Karte zum Beispiel …
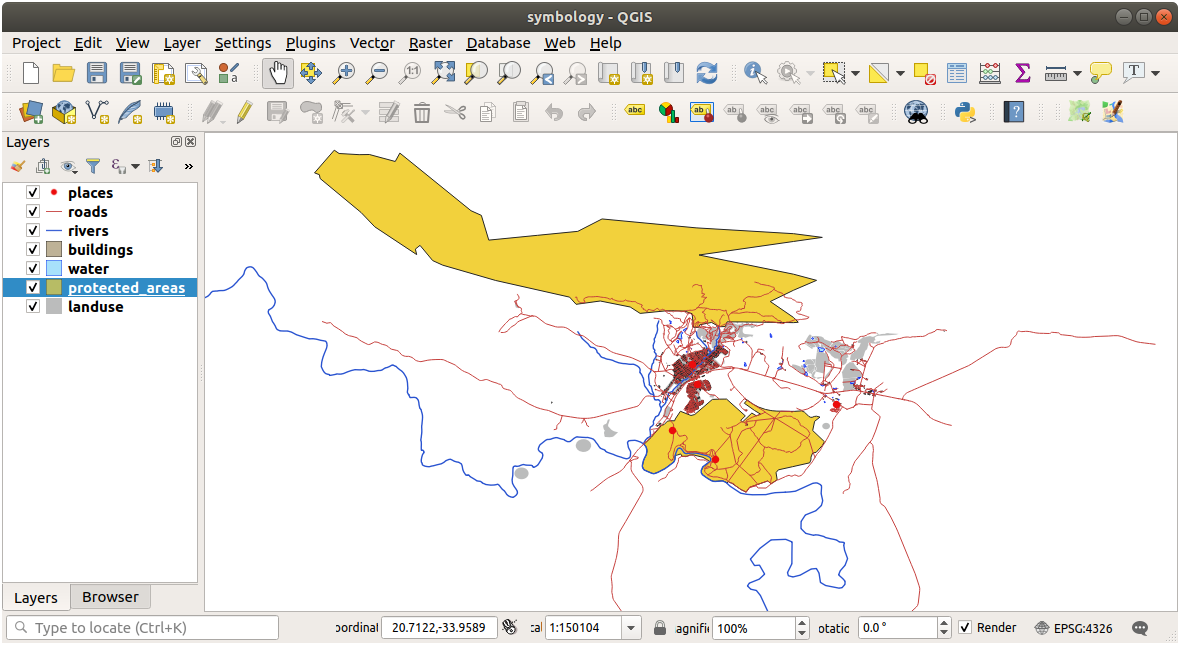
… ist nicht sehr hilfreich. In diesem Maßstab sind die Gebäude schwer zu unterscheiden.
So aktivieren Sie maßstabsbasiertes Rendering:
Öffnen Sie den Layer-Eigenschaften-Dialog für den
Gebäude-Layer.Aktivieren Sie die maßstabsabhängige Darstellung, indem Sie das Kontrollkästchen Maßstabsabhängige Sichtbarkeit :aktivieren.
Ändern Sie den Minimum-Wert zu
1:10000.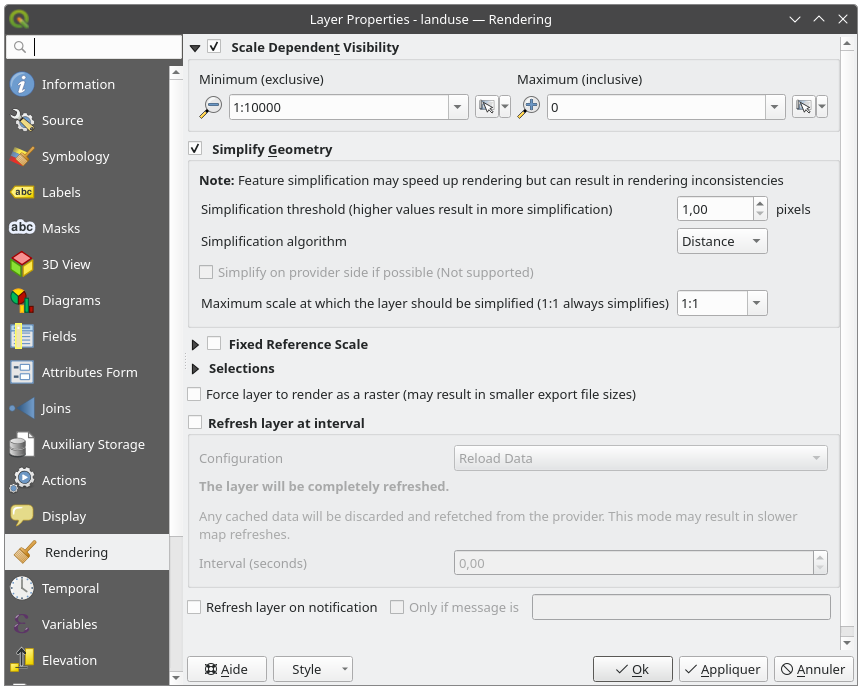
Klicken Sie OK.
Testen Sie die Auswirkungen, indem Sie in Ihrer Karte hinein- und herauszoomen und dabei darauf achten, wann der Gebäude-Layer verschwindet und wieder erscheint.
2.4.6. ★★☆ Machen Sie mit: Symbol-Layer hinzufügen
Nachdem Sie nun wissen, wie Sie eine einfache Symbologie für Layer ändern, besteht der nächste Schritt darin, komplexere Symbologien zu erstellen. QGIS ermöglicht Ihnen dies mithilfe von Symbol-Layern.
Gehen Sie zurück zu den
Landnuzungs-Layer-Eigenschaften indem Sie in der Seitenleiste unter Symbologie auf Einfache Füllung klicken.In diesem Beispiel hat das aktuelle Symbol keine Umrisslinie (d. h. es verwendet den Rahmenstil Keine Linie).

Wählen Sie Füllung und klicken Sie auf die
 Symbol-Ebene hinzufügen. Das Dialogfeld ändert sich und sieht ungefähr so aus, wobei eine neue Symbolebene hinzugefügt wurde:
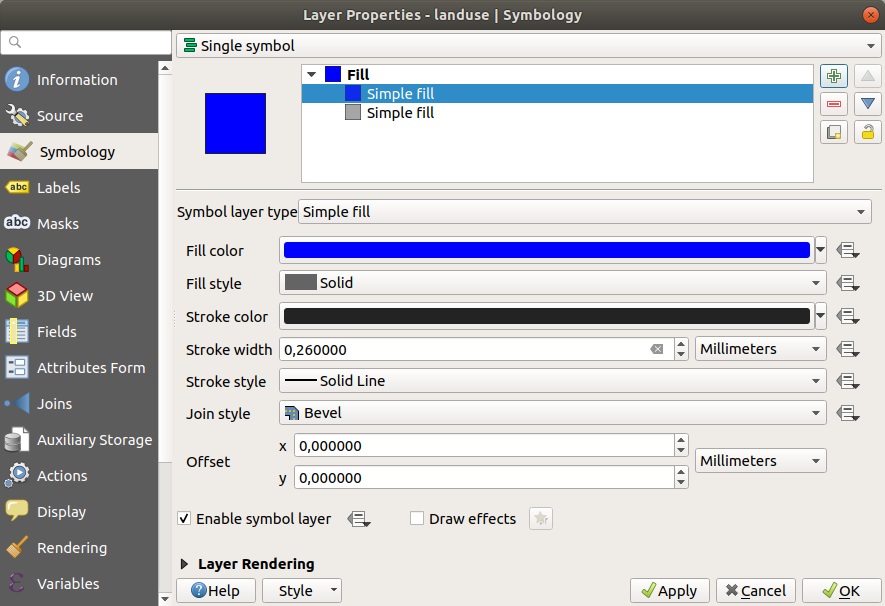
Die Farbe mag etwas anders aussehen, aber das werden Sie sowieso ändern..
Jetzt gibt es eine zweite Symbolebene. Da sie eine Volltonfarbe hat, wird sie natürlich die vorherige Symbolart vollständig verbergen. Außerdem hat sie einen Ganze Linie-Stil, den wir nicht wollen. Dieses Symbol muss eindeutig geändert werden.
Bemerkung
Es ist wichtig, einen Kartenlayer nicht mit einer Symbolebene zu verwechseln. Eine Kartenebene ist ein Vektor (oder Raster), der in die Karte geladen wurde. Eine Symbolebene ist Teil des Symbols, das zur Darstellung eines Kartenlayers verwendet wird. In diesem Kurs wird ein Kartenlayer normalerweise nur als Layer bezeichnet, eine Symbolebene wird jedoch immer als Symbolebene bezeichnet, um Verwechslungen vorzubeugen.
Mit der ausgewählten neuen Symbolebene „Einfache Füllung“ :
Stellen Sie den Rahmenstil wie zuvor auf guilabel:Keine Line ein.
Ändern Sie den Füllstil in einen anderen Stil als “ Vollständig or Kein Pinsel. Zum Beispiel:
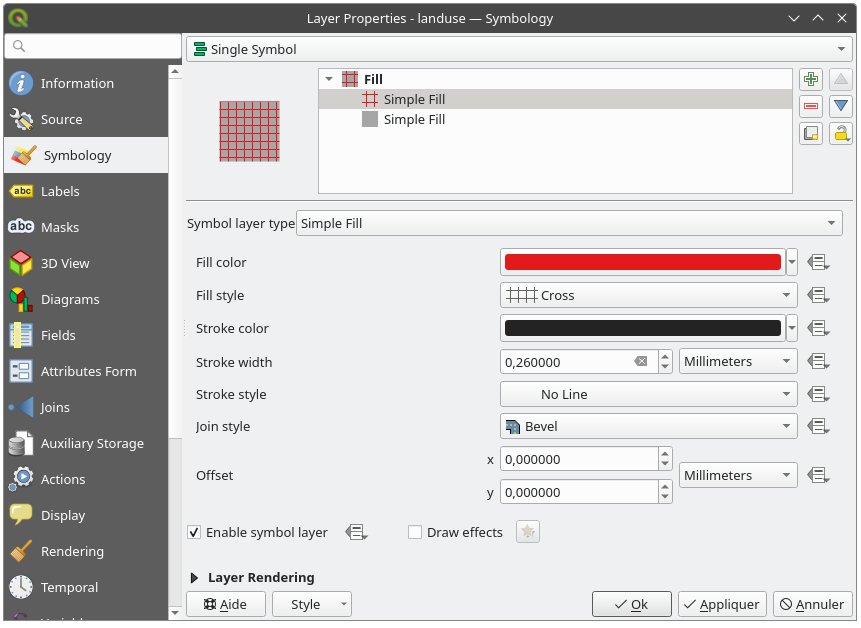
Klicken Sie OK.
Jetzt können Sie Ihre Ergebnisse sehen und sie nach Bedarf optimieren. Sie können sogar mehrere zusätzliche Symbolebenen hinzufügen und auf diese Weise eine Art Textur für Ihre Ebene erstellen.
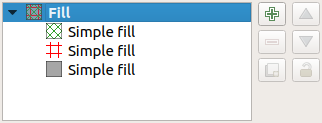
Es macht Spaß! Aber es hat wahrscheinlich zu viele Farben, um es in einer echten Karte zu verwenden …
2.4.7. ★★☆ Probieren Sie es selbst aus:
Denken Sie daran, bei Bedarf hineinzuzoomen, und erstellen Sie mit den oben beschriebenen Methoden eine einfache, aber nicht störende Textur für den Gebäude-Layer.
Antwort
Passen Sie Ihren Gebäude-Layer nach Belieben an, aber denken Sie daran, dass die verschiedenen Layer auf der Karte leicht voneinander zu unterscheiden sein müssen.
Im Folgenden ein Beispiel:
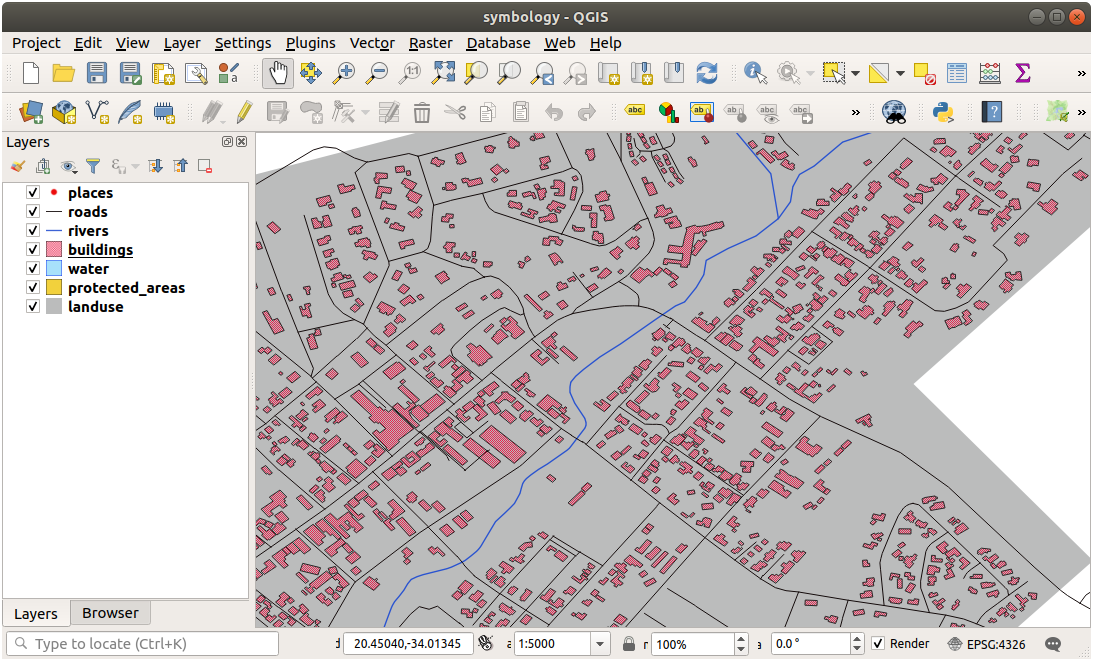
2.4.8. ★★☆ Machen Sie mit: Symbolebenen anordnen
Beim Rendern von Symbolebenen erfolgt dies ebenfalls in einer Sequenz, ähnlich der Renderung verschiedener Kartenlayern. Dies bedeutet, dass in einigen Fällen das Vorhandensein mehrerer Symbolebenen in einem Symbol zu unerwarteten Ergebnissen führen kann.
Geben Sie dem
Straßen-Layer eine zusätzliche Symbolebene (mithilfe der oben gezeigten Methode zum Hinzufügen von Symbolebenen).Geben Sie der Grundlinie eine Strichstärke of
1.5und die Farbe Schwarz.Geben Sie der neuen, obersten Schicht eine Dicke von
0.8und die Farbe Weiß.
Sie werden feststellen, dass Folgendes passiert:
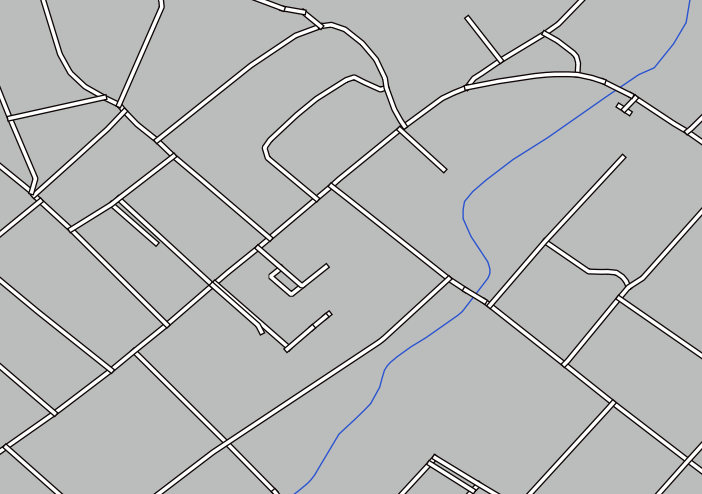
Nun, Straßen haben jetzt eine straßenähnliche Symbolik, aber Sie sehen, dass sich die Linien an jeder Kreuzung überlappen. Das ist überhaupt nicht das, was wir wollen!
Um dies zu verhindern, können Sie die Symbolebenen sortieren und deren Reihenfolge so ordnen, wie sie gerendert werden.
So ändern Sie die Reihenfolge der Symbolebenen:
Wählen Sie die oberste Linie nebene im Linienfenster aus.
Klicken Sie unten rechts im Fenster auf Erweitert ► Symbolebenen….
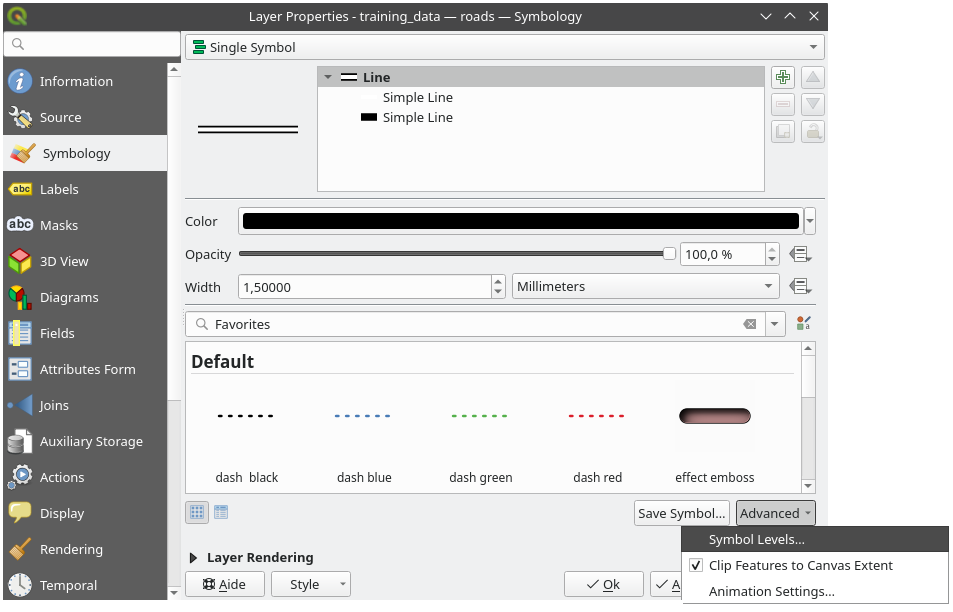
Dadurch wird ein Dialogfenster wie dieses geöffnet:
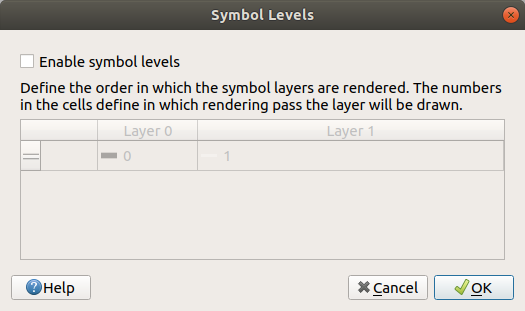
Aktivieren Sie
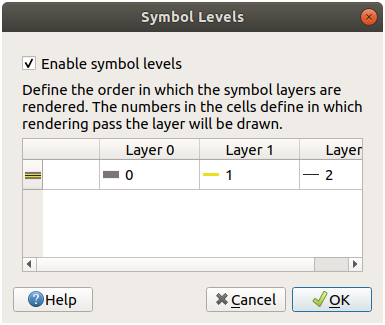
 Symbolebenen aktivieren. Anschließend können Sie die Ebenenreihenfolge der einzelnen Symbole festlegen, indem Sie die entsprechende Ebenennummer eingeben. 0 ist die unterste Ebene.
In unserem Fall wollen wir nur die Option aktivieren, so:
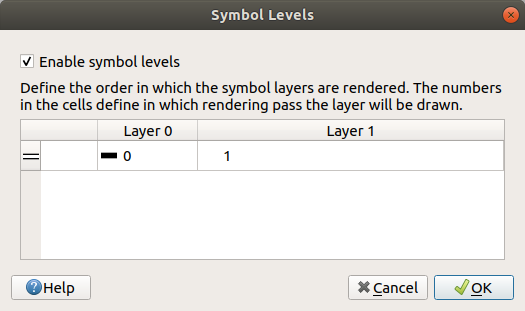
Das wird die weiße Linie über die dicken schwarzen Liniengrenzen zeichnen:
Klicken Sie zweimal auf OK um zur Karte zurückzukehren.
So wird die Karte nun aussehen:
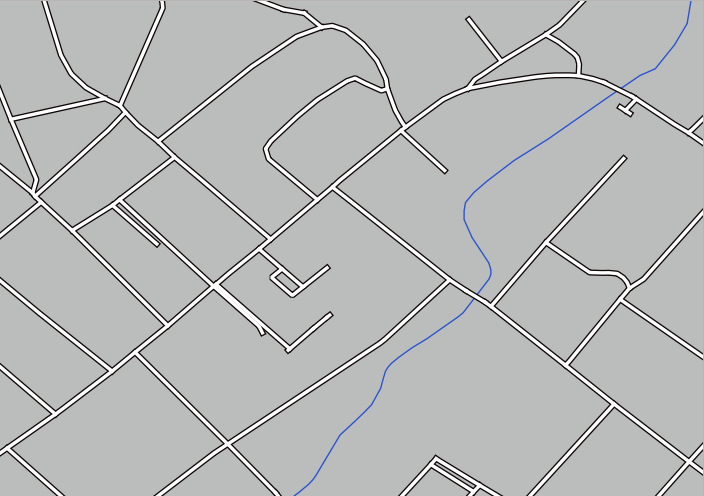
Denken Sie daran, Ihre Symbolisierung zu speichern, wenn Sie fertig sind, damit Sie Ihre Arbeit nicht verlieren, falls Sie sie zukünftig nochmal benötigen. Speichern Sie die aktuelle Symbolisierung durch einen Klick auf die Schaltfläche Speichere Stil… unten im Dialog Layereigenschaften. Wir werden das Format QGIS-QML-Layerstildatei benutzen.
Speichern Sie Ihren Stil im Ordner solution/styles/better_roads.qml. Laden Sie einen gespeicherten Stil über die Schaltfläche Lade Stil…. Bevor Sie den Stil ändern, sollten Sie aber bedenken, dass jeder nicht gespeicherte Stil verloren ist, den Sie ersetzen.
2.4.9. ★★☆ Probieren Sie es selbst aus:
Ändern Sie nochmals das Aussehen des Layers Straßen.
Machen Sie die Straßen schmal und gelb mit einer dünnen hellgrauen Außenlinie und einer dünnen schwarzen Linie in der Mitte. Denken Sie daran, dass es nötig sein kann, die Zeichenreihenfolge des Layers mittels des Dialogs zu verändern.

Antwort
Für die gewünschte Symbolisierung benötigen Sie drei Symbollayer:
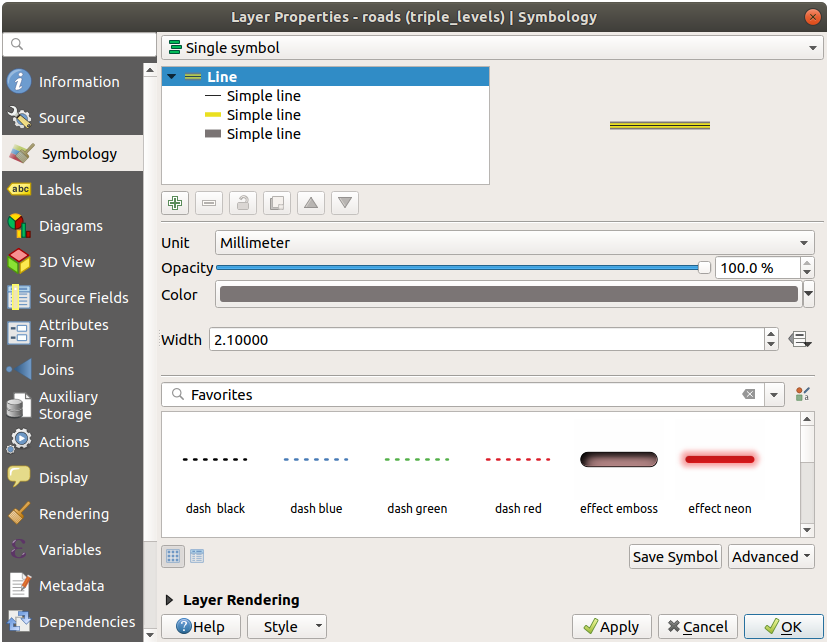
Der unterste Symbollayer ist eine breite durchgezogene graue Linie. Darauf kommt eine etwas dünnere durchgezogene gelbe Linie und den Abschluss bildet eine weitere noch dünnere durchgezogene schwarze Linie.
Falls Ihre Symbollayer so ähnlich aussehen wie oben, das Ergebnis aber nicht so ist, wie Sie es sich vorstellen:
Prüfen Sie, ob Ihre Symbolebenen so ähnlich wie hier aussehen:
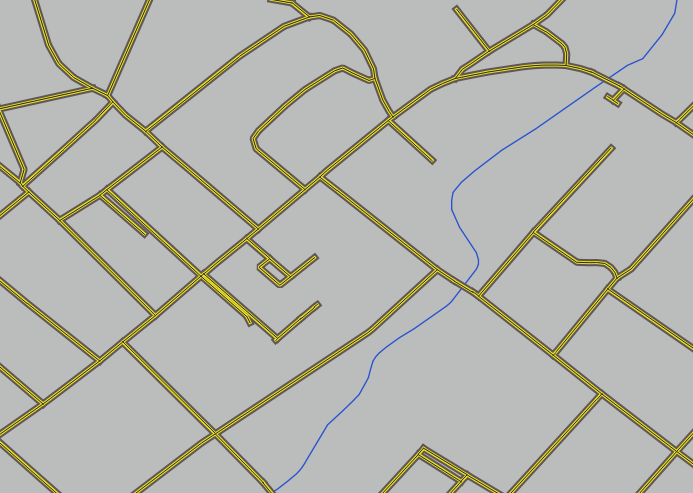
Ihre Karte sollte nun so aussehen:
2.4.10. ★★★ Probieren Sie es selbst:
Symbolebenen funktionieren auch bei klassifizierten Layern (d.h. Layern mit mehreren Symbolen). Da wir die Klassifikation noch nicht besprochen haben, werden Sie mit rudimentär vorklassifizierten Daten arbeiten.
Legen Sie ein neues Projekt an und laden Sie nur den Datensatz
Straßen.Wenden Sie die Stildatei
advanced_levels_demo.qmlausexercise_data/stylesauf den Layer an. Das können Sie über das Kombinationsfeld unten im Dialog Layereigenschaften.Zoomen Sie auf das Gebiet Swellendam.
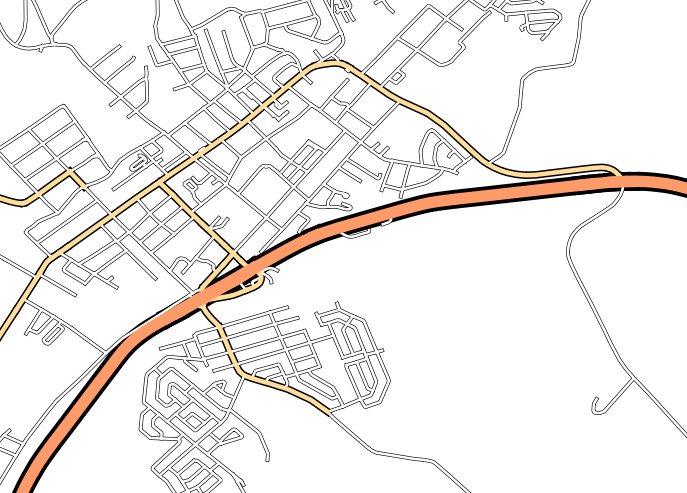
Stellen Sie über die Symbolebenen sicher, dass die Außenlinien der Layer ineinanderfließen, so wie im Bild unten:
Antwort
Stellen Sie Ihre Symbolebenen auf diese Werte ein:
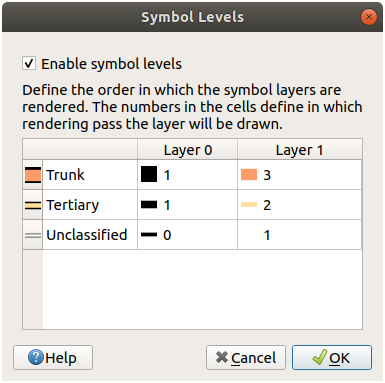
Spielen Sie mit verschiedenen Werten, um verschiedene Ergebnisse zu erhalten.
Öffnen Sie Ihre ursprüngliche Karte wieder, bevor Sie mit der nächsten Übung fortfahren.
2.4.11. ★★☆ Machen Sie mit: Symbollayertypen
Zusätzlich zu Füllfarben und vordefinierten Mustern, können Sie verschiedene Symbollayertypen benutzen. Bisher haben wir nur den Typ Einfache Füllung benutzt. Passen Sie Ihre Symbole mit den fortgeschrittenen Symbollayertypen an Ihre Wünsche an.
Jeder Vektortyp (Punkt, Linie und Polygon) hat seine eigenen Symbollayertypen. Zunächst werden wir uns die für Punkte verfügbaren Typen ansehen.
Symbollayertypen für Punkte
Schalten Sie alle Layer außer
placesaus.Ändern Sie die Symboleigenschaften für den Layer
places: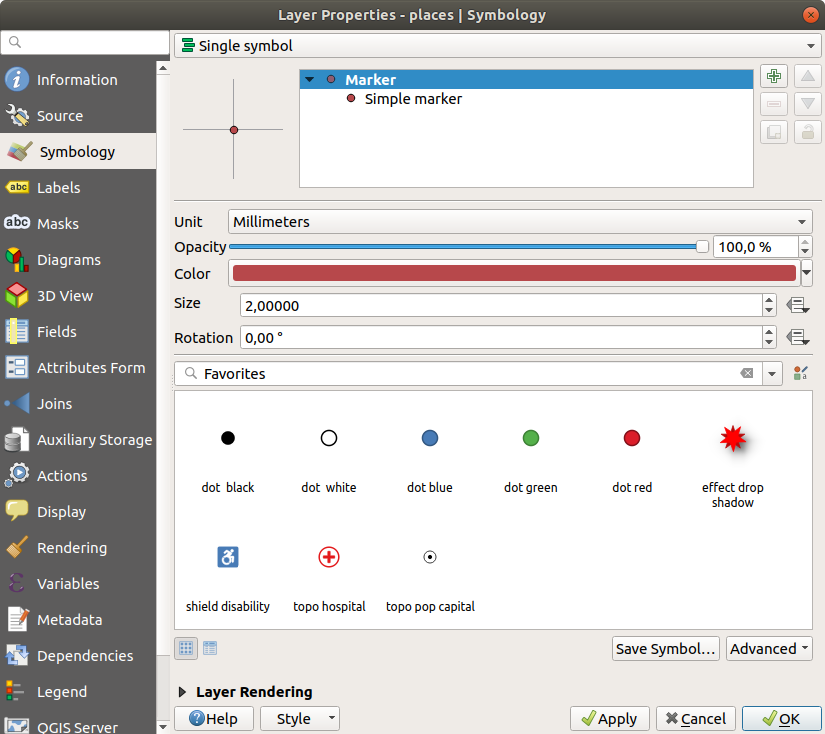
Greifen Sie auf die verschiedenen Symbollayertypen zu, indem Sie den Layer Einfache Markierung im Symbollayerbaum anwählen und dann auf das Aufklappmenü Symbollayertypen klicken:
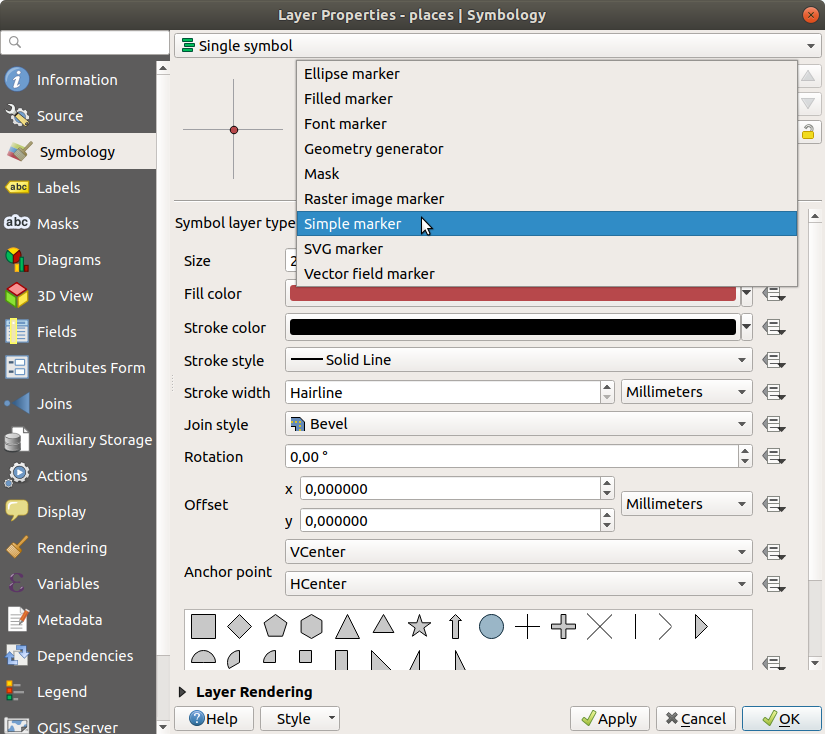
Sehen Sie sich die verschiedenen Möglichkeiten an und wählen Sie ein Symbol mit einer Darstellung, die Sie für geeignet halten.
Sollten Sie sich nicht sicher sein, wählen Sie eine Einfache Markierung mit einem weißen Rand und einer hellgrünen Füllung mit einer Größe von
3,00und einer Strichbreite von0,5.
Symbollayertypen für Linien
So zeigen Sie die für Liniendaten verfügbaren Möglichkeiten an:
Ändern Sie den Symbollayertyp für den obersten Symbollayer des Layers
roadsauf Markierungslinie: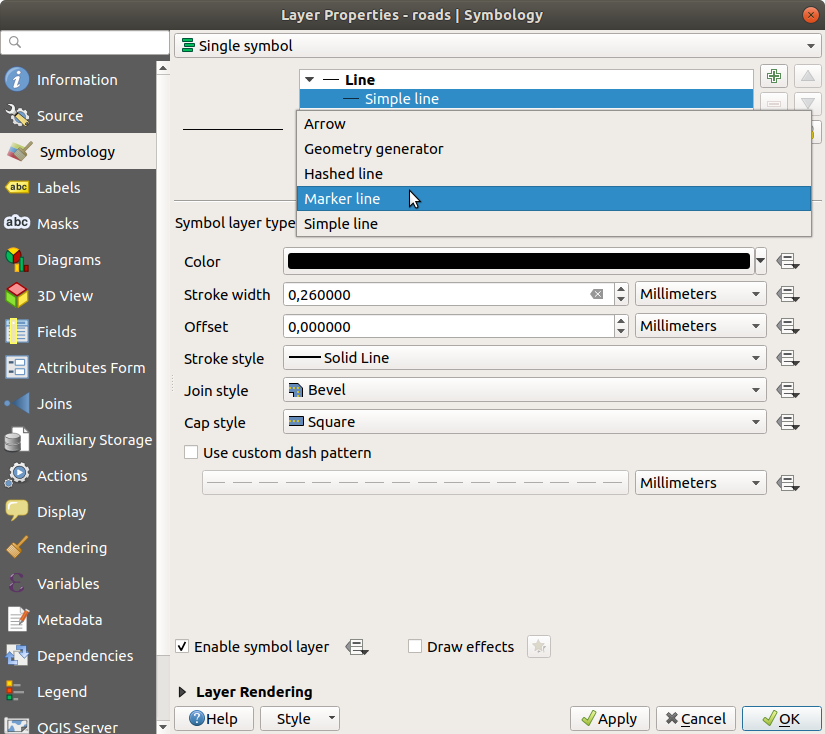
Wählen Sie den Eintrag Einfache Markierung im Symbollayerbaum aus. Ändern Sie die Symboleigenschaften so wie in diesem Dialog gezeigt:
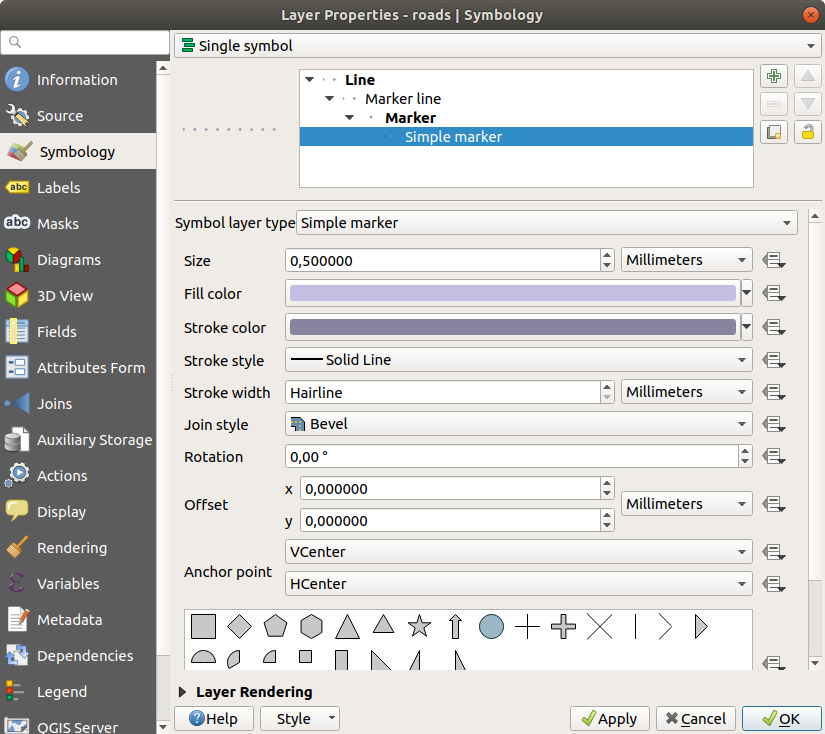
Wählen Sie den Eintrag Markierungslinie und ändern Sie den Intervall auf
1,00: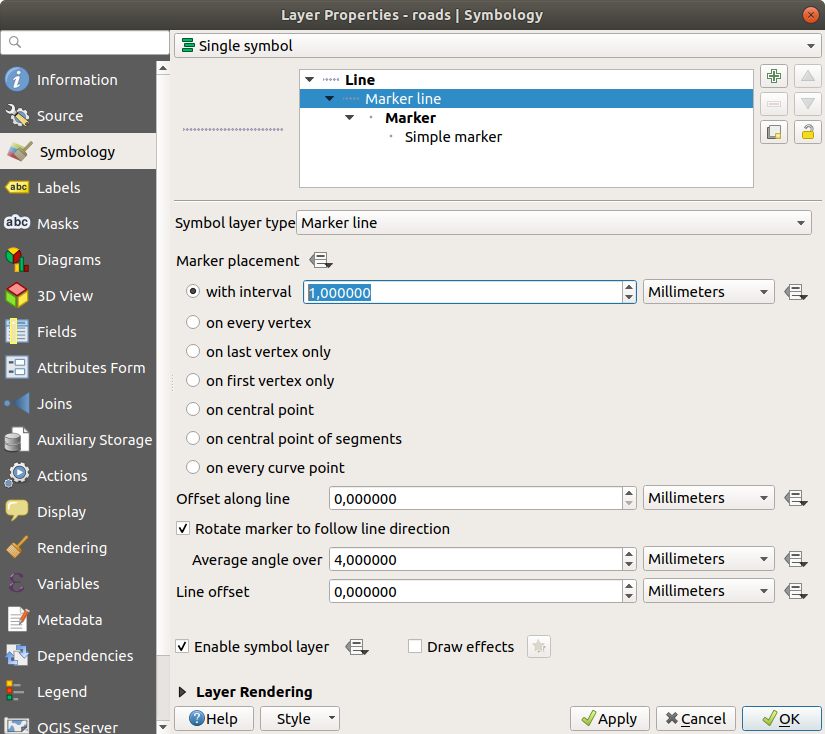
Stellen Sie sicher, dass die Symbolebenen korrekt eingestellt sind (über den oben benutzen Dialog ), bevor Sie den Stil anwenden.
Sehen Sie sich das Ergebnis auf der Karte an, sobald Sie den Stil angewendet haben. Wie Sie sehen, ändern die Markierungen ihre Richtung entlang der Linie, passen sich ihr aber nicht immer an. Das ist manchmal ganz nützlich, manchmal aber auch nicht. Wenn Sie es wünschen, können Sie den benutzten Symbollayer wieder so einstellen, wie er vorher war.
Symbollayertypen für Polygone
So zeigen Sie die für Polygondaten verfügbaren Möglichkeiten an:
Ändern Sie den Symbollayertyp des Layers ``water``wie vorher für die anderen Layer.
Untersuchen Sie, was die einzelnen Möglichkeiten in der Liste bewirken.
Wählen Sie einen aus, den sie für geeignet halten.
Benutzen Sie im Zweifel Punktmusterfüllung mit folgenden Einstellungen:
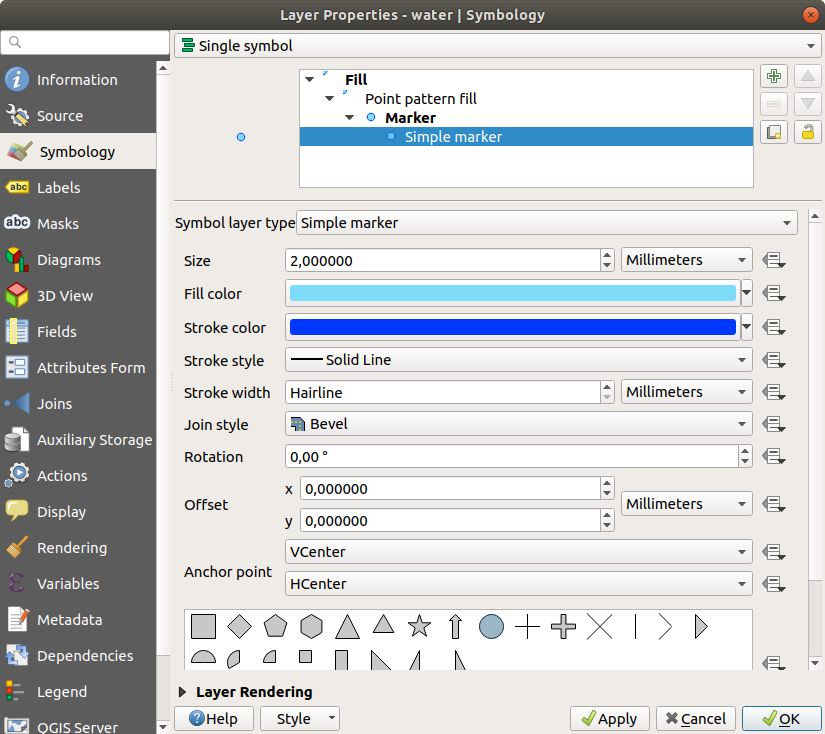
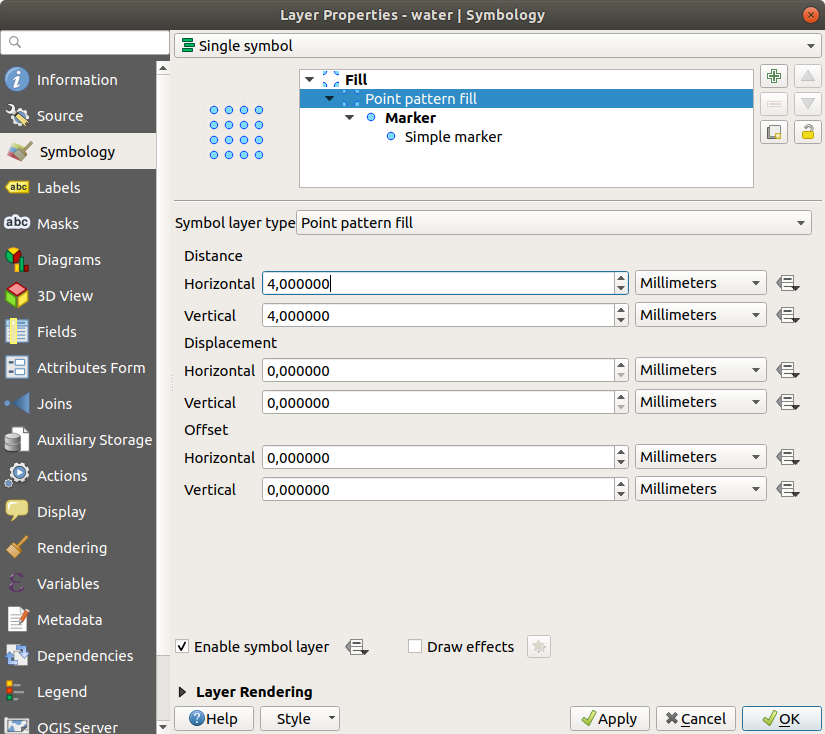
Fügen Sie einen neuen Symbollayer mit der normalen Einfachen Füllung ein.
Wählen Sie das selbe helle Blau mit einer Grenzlinie in dunklerem Blau.
Verschieben Sie ihn mit der Schaltfläche Verschiebe abwärts unter den Eintrag mit der Punktmusterfüllung:
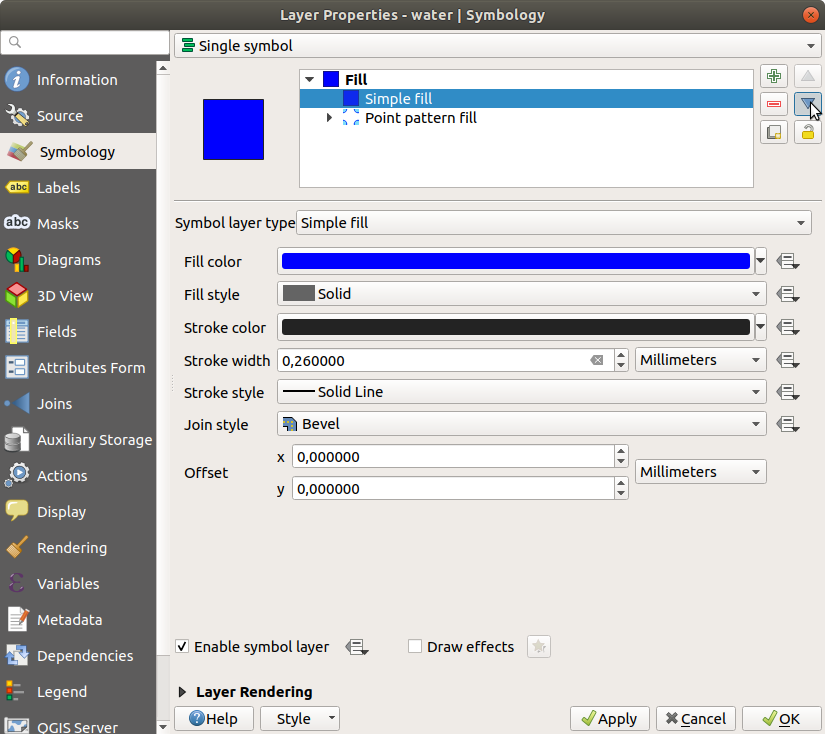
Das Ergebnis ist ein texturiertes Symbol für den Wasserlayer, wobei Sie Größe, Form und Abstand der einzelnen Punkte verändern können, die die Textur erzeugen.
2.4.12. ★★☆ Probieren Sie es selbst aus:
Stellen Sie für den Layer protected_areas eine transparente grüne Farbe als Füllung ein und ändern Sie den Rand so, dass er folgendermaßen aussieht:
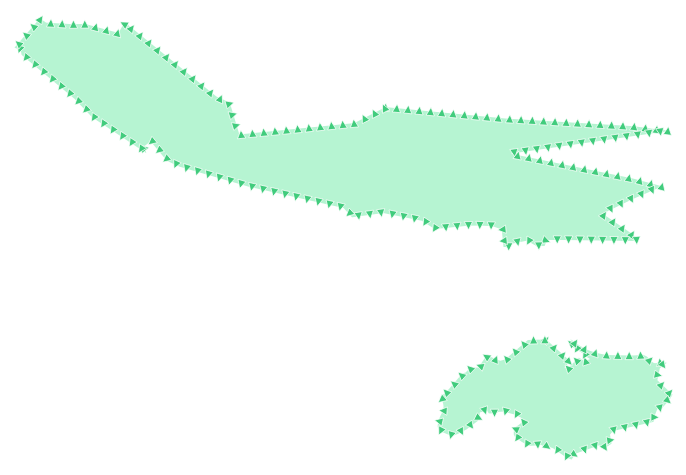
Antwort
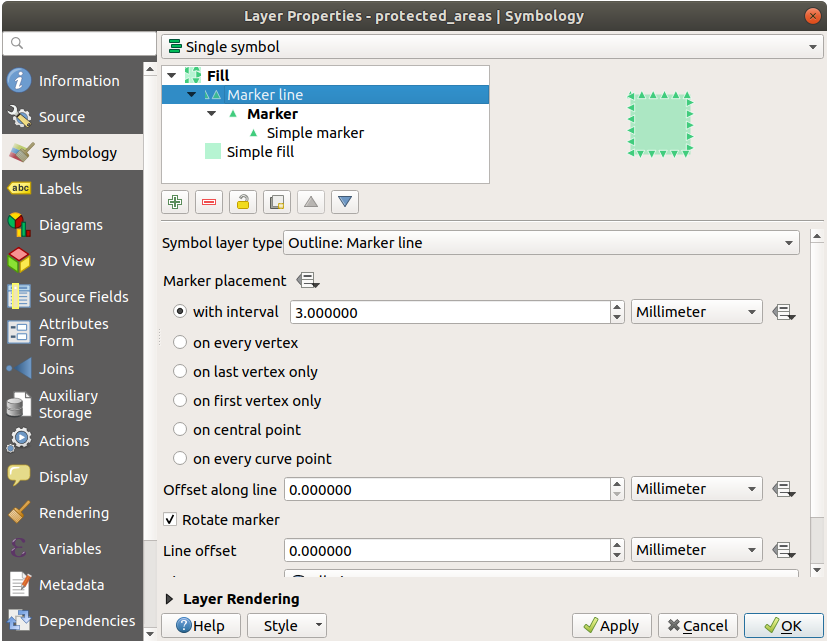
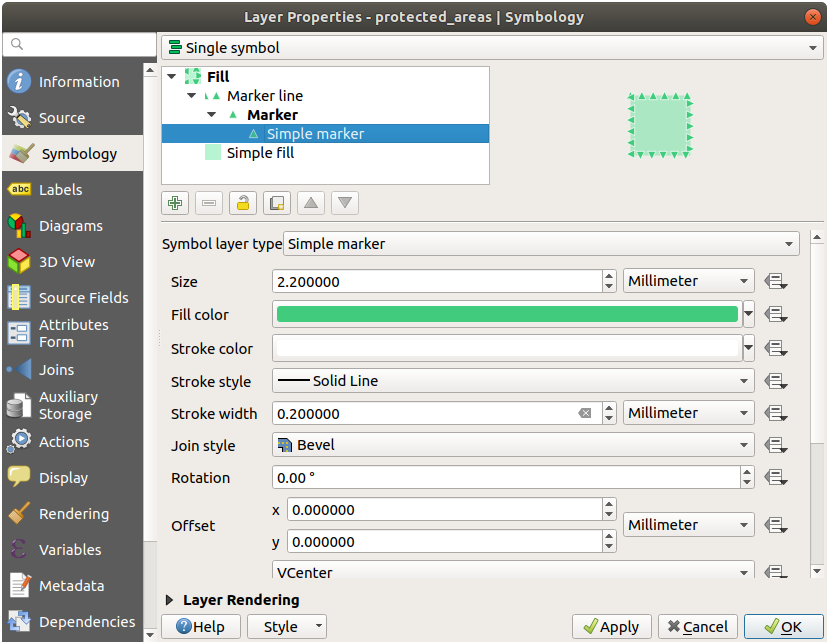
Einige Beispiele für die Symbolstruktur:
2.4.13. ★★★ Machen Sie mit: Symbolisierung mit dem Geometriegenerator
Die Symbolisierung mit dem Geometriegenerator können Sie für alle Arten von Layern benutzen (Punkte, Linien und Polygone). Das Ergebnis hängt direkt von der Art des Layers ab.
Kurz gesagt können Sie mit der Symbolisierung per Geometriegenerator räumliche Operationen mit der Symbolisierung selbst durchführen. Z.B. die Berechnung von Zentroiden für einen Polygonlayer, ohne einen separaten Punktlayer zu erzeugen.
Ja, Sie haben sogar alle Möglichkeiten für die Darstellung des sich daraus ergebenden Symbols.
Na dann los!
Wählen Sie den Layer `water`.
Klicken Sie auf Einfache Füllung und ändern Sie den Symbollayertyp auf Geometriegenerator.
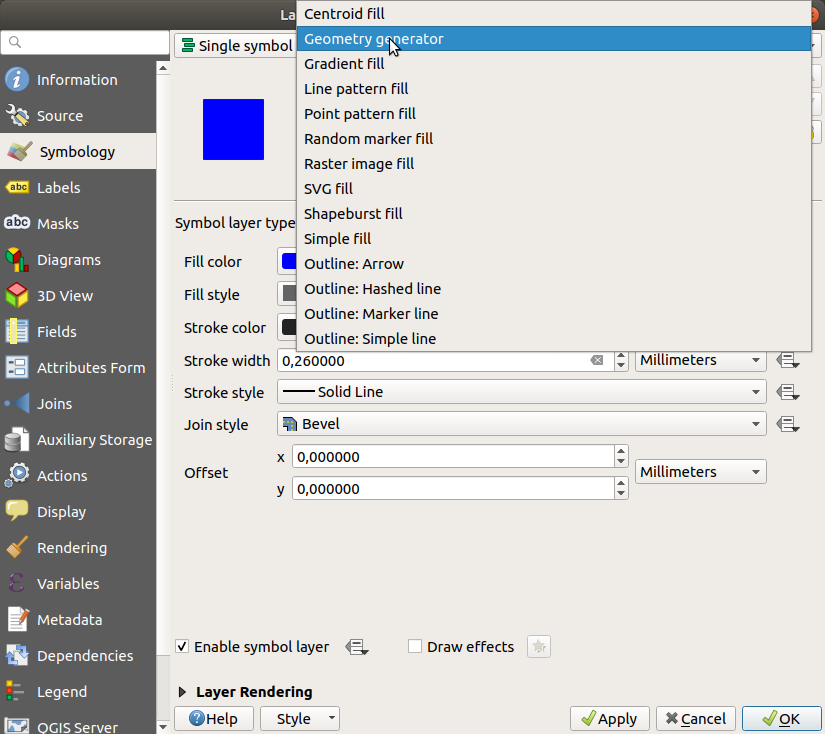
Bevor wir jedoch eine räumliche Abfrage schreiben, müssen wir erst den Geometrietyp des Ergebnisses auswählen. In diesem Anwendungsbeispiel werden wir Zentroide für jedes Objekt erzeugen. Ändern Sie den Geometrietyp deshalb bitte auf guilabel:Point / Multipoint.
Jetzt schreiben wir die Abfrage in das Abfragefeld:
centroid($geometry)
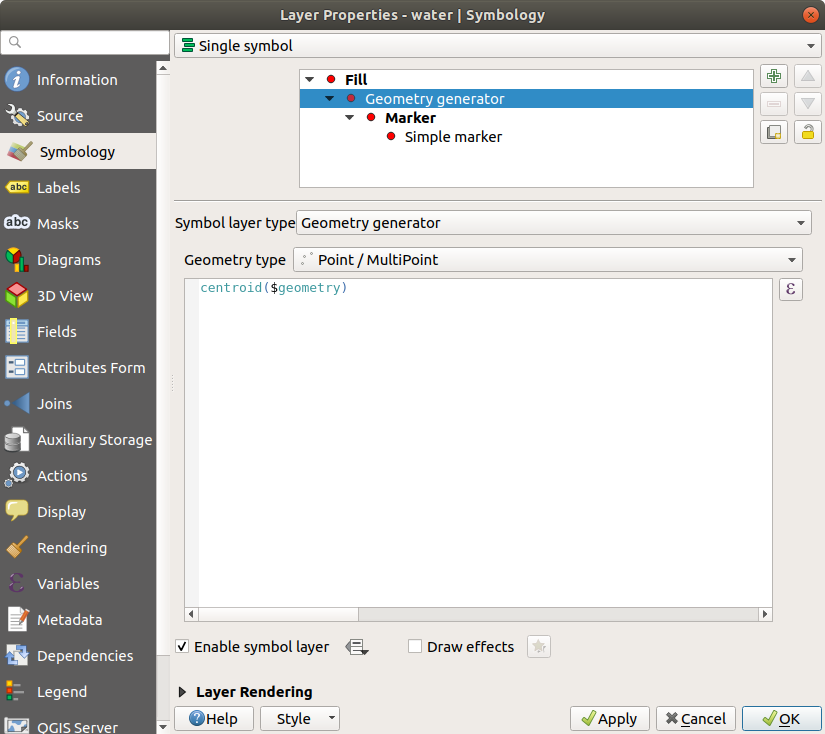
Klicken Sie auf OK um zu sehen, dass der Layer
waterjetzt als Punktlayer gezeichnet wird! Wir haben gerade eine räumliche Berechnung innerhalb der Symbolisierung des Layers durchgeführt. Ist das nicht toll?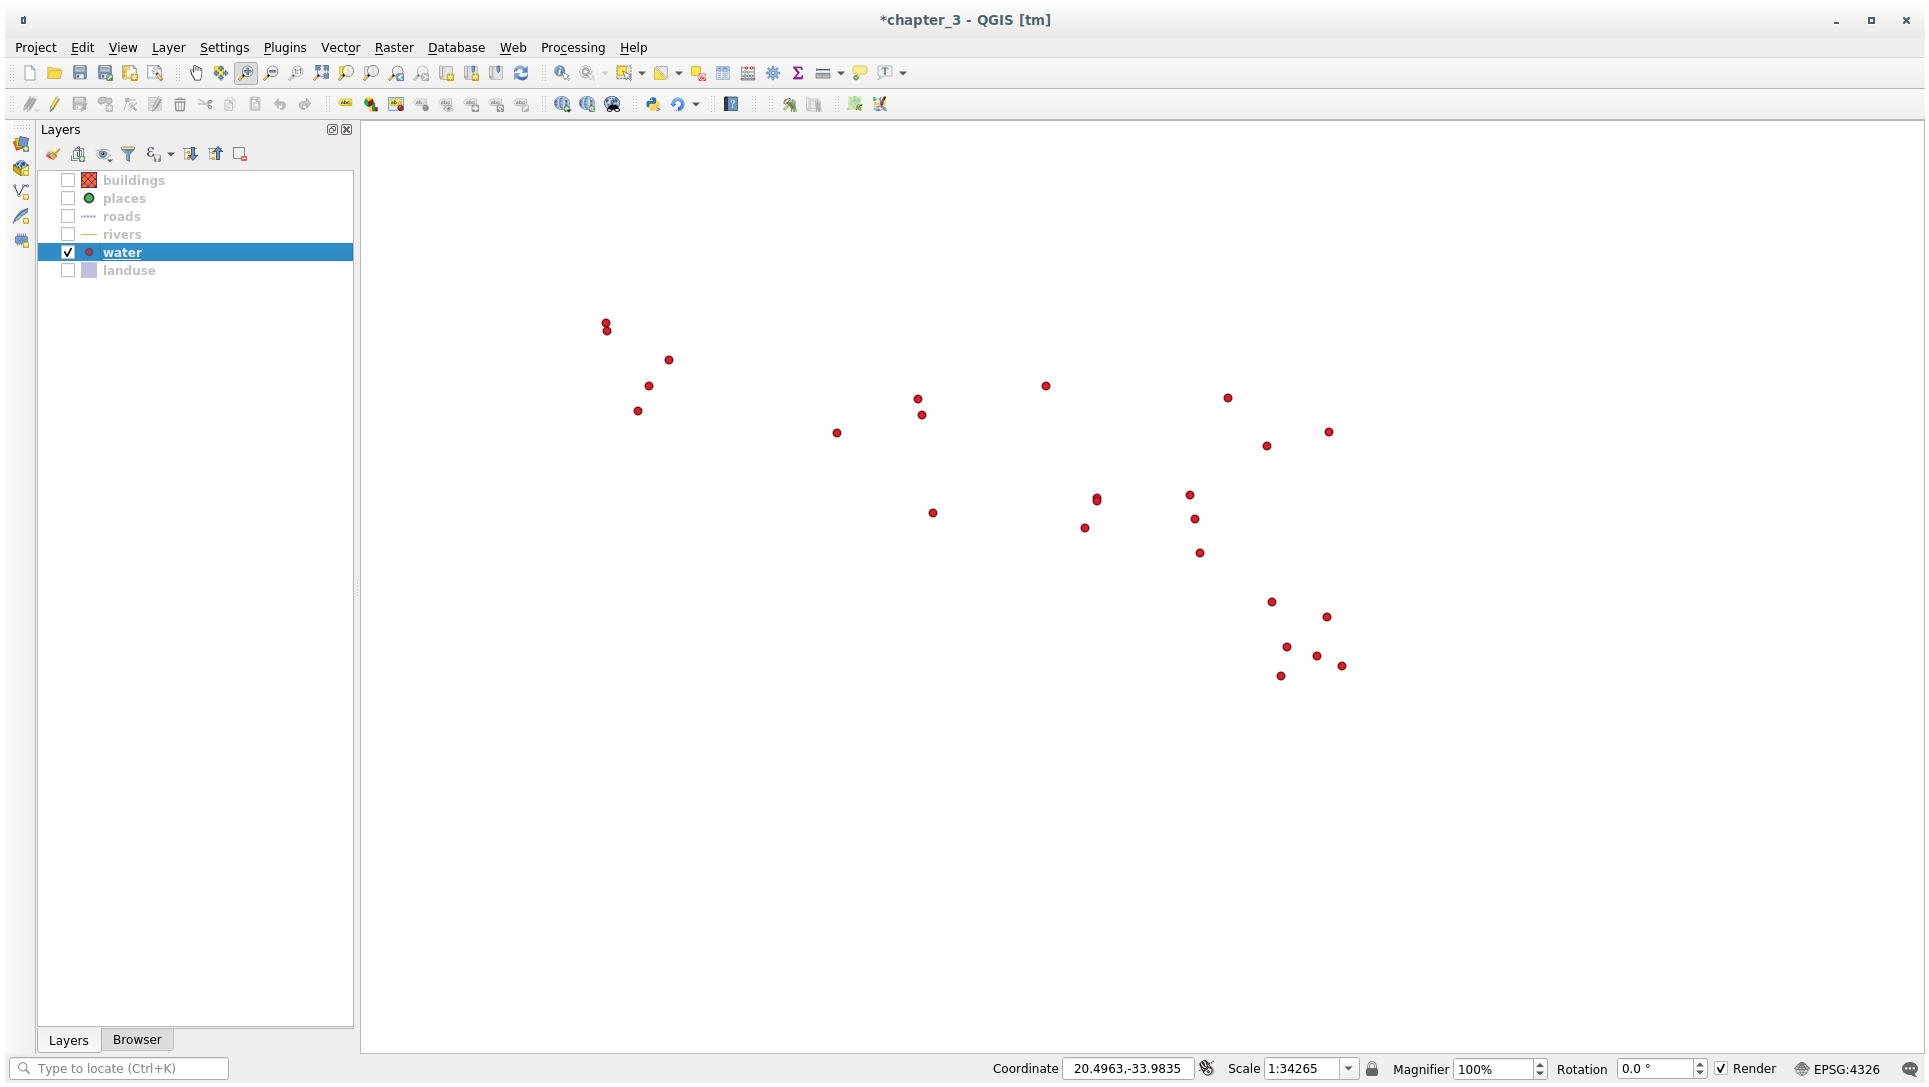
Mit dem Geometriegenerator überschreiten Sie die Grenzen normaler Symbolisierung.
★★★ Probieren Sie es selbst:
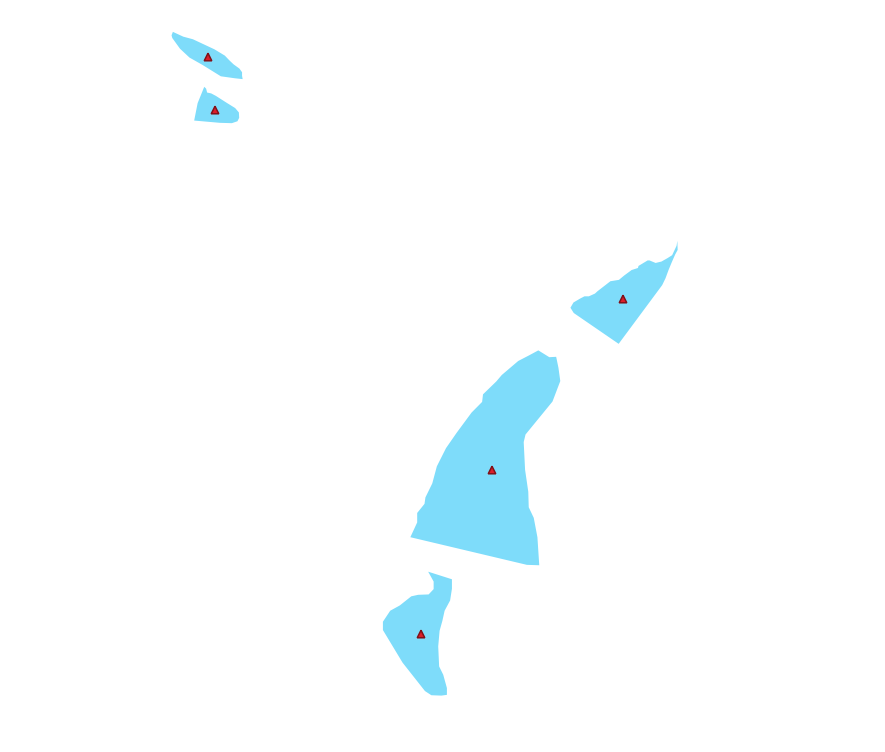
Der Geometriegenerator ist einfach eine weitere Symbolebene. Fügen Sie eine weitere Einfache Füllung unterhalb des Geometriegenerators ein.
Ändern Sie auch die Darstellung des Einfachen Markers für den Eintrag Geometriegenerator.
Das Endergebnis sollte so ähnlich aussehen:
Antwort
Klicken Sie auf die Schaltfläche
 und fügen Sie eine andere Symbolebene hinzu.
Bewegen Sie die neue Symbolebene ganz nach unten durch einen Klick auf die Schaltfläche
 .
.Wählen Sie eine passende Farbe als Füllung der Polygone mit den Wasserflächen.
Klicken Sie auf Markierung der Symbolebene des Geometriegenerators und ersetzen Sie den Kreis mit einem Markierungssymbol Ihrer Wahl.
Probieren Sie andere Möglichkeiten aus, um sinnvolle Ergebnisse zu erzeielen.
2.4.14. ★★★ Machen Sie mit: Herstellen einer eigenen SVG-Füllung
Bemerkung
Für diese Übung müssen Sie die freie Vektorgraphiksoftware Inkscape installieren.
Starten Sie Inkscape. Sie werden folgende Benutzeroberfläche sehen:
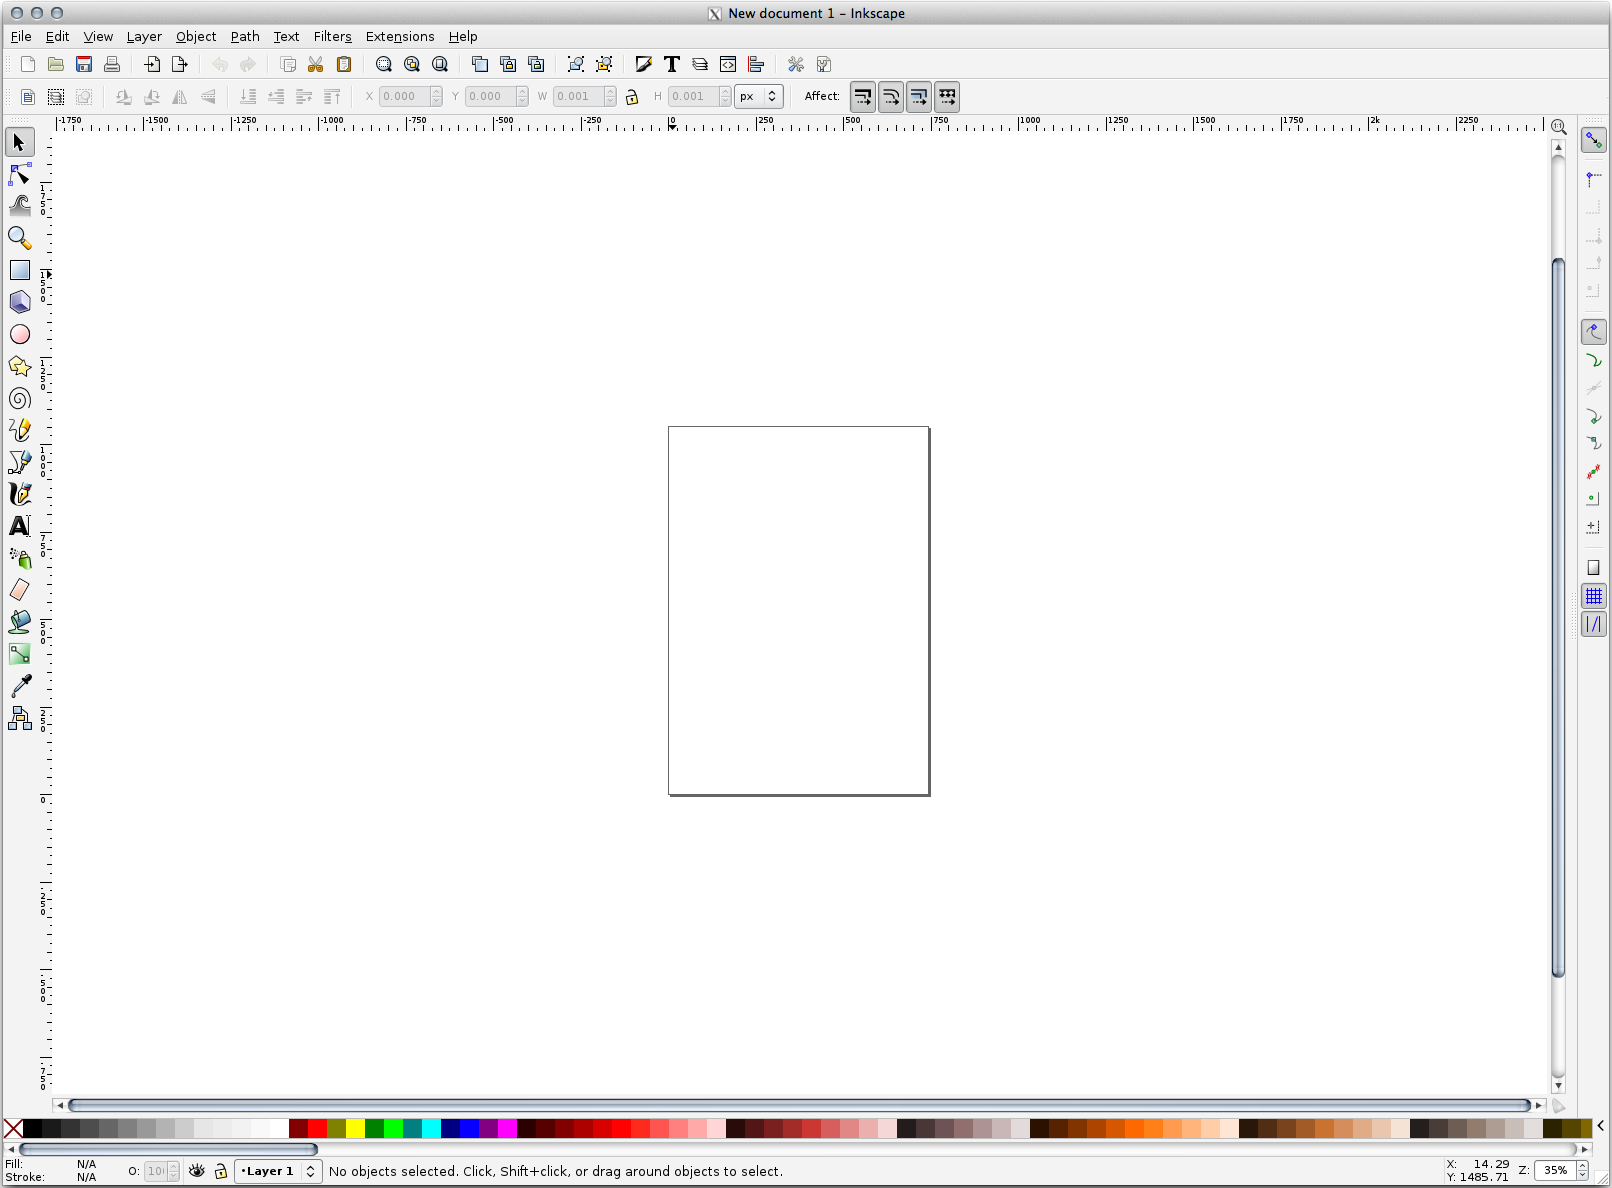
Falls Sie bereits andere Programme zum Editieren von Vektorgraphiken benutzt haben, z.B. Corel, wird Ihnen das bekannt vorkommen.
Zuerst werden wir die Größe der Zeichenfläche auf einen Wert einstellen, der für eine kleine Graphik geeignet ist.
Klicken Sie auf den Menüeintrag . Damit öffnen Sie den Dialog Dokumenteneinstellungen.
Ändern Sie die Einheit auf px.
Ändern Sie Breite und Höhe auf jeweils
100.Schließen Sie den Dialog, wenn Sie fertig sind.
Klicken Sie auf den Menüpunkt , um die Seite anzuzeigen, auf der Sie arbeiten.
Wäheln Sie das Ellipsenwerkzeug:
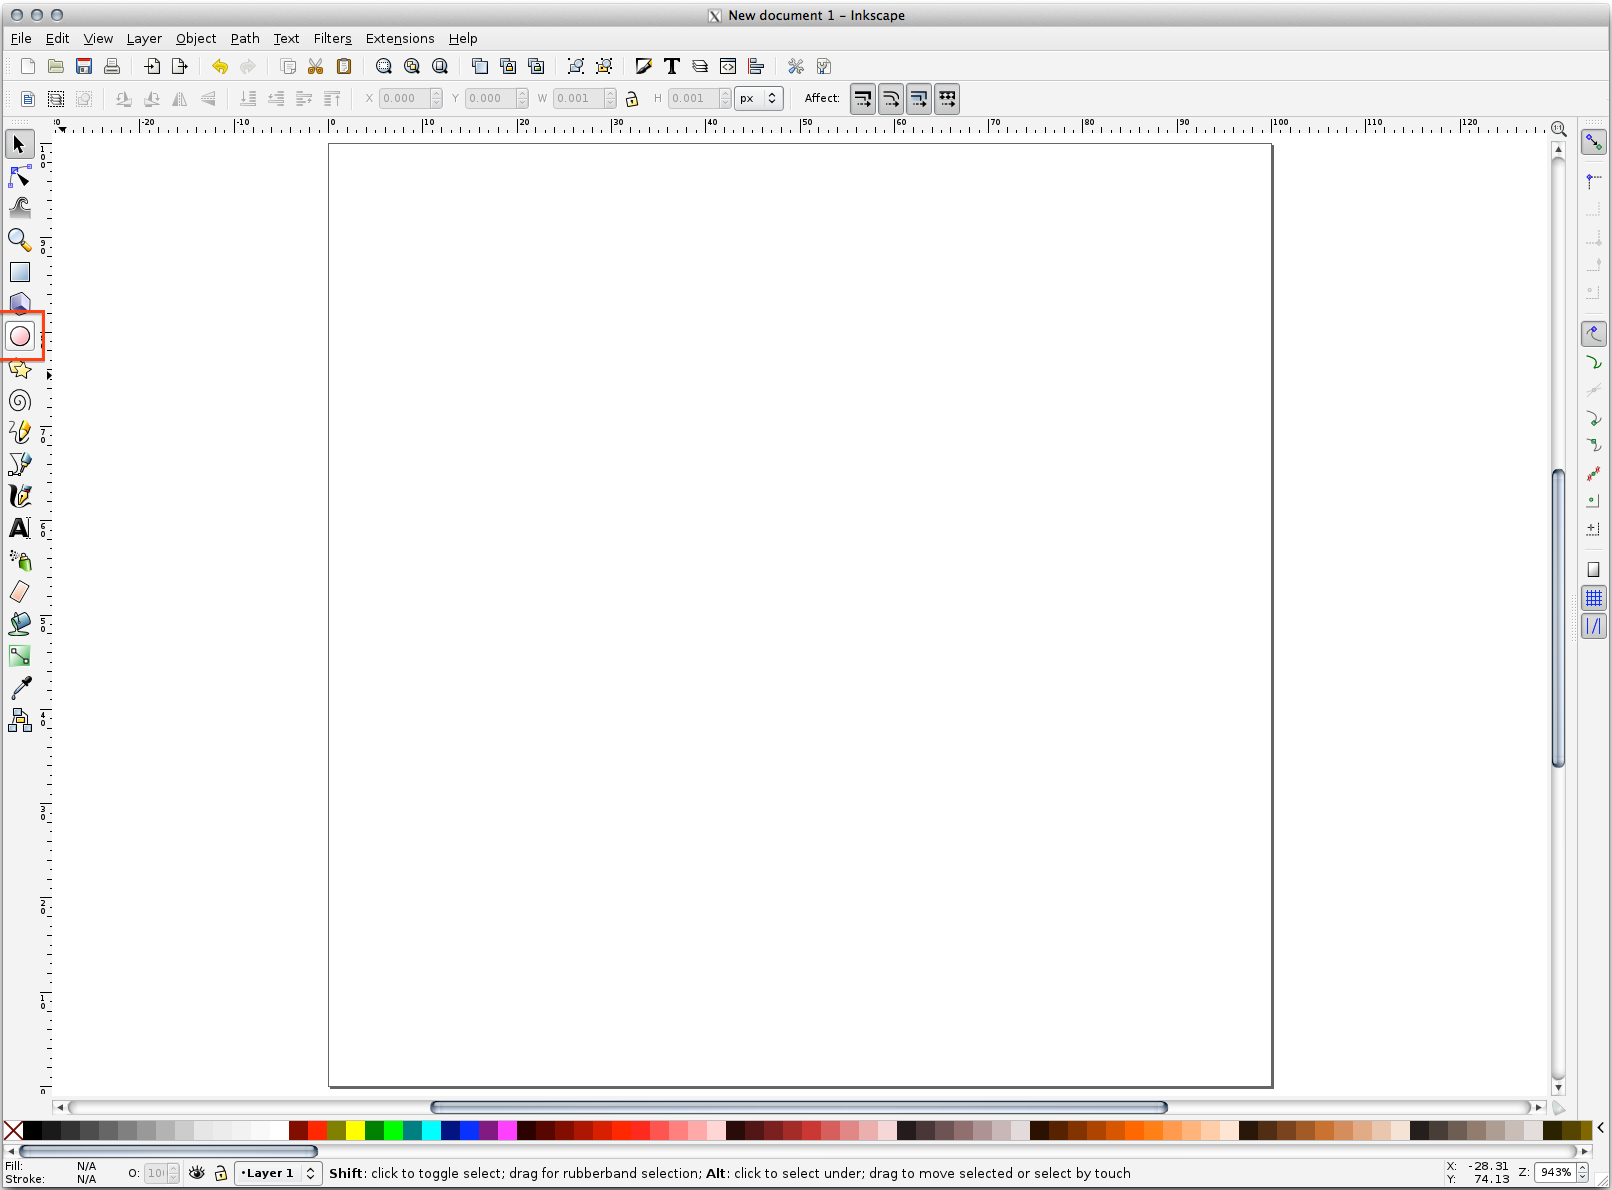
Klicken Sie auf die Seite und ziehen Sie mit gedrückter Maustaste eine Ellipse auf. Halten Sie die Taste Strg während Sie sie aufziehen, dann wird aus der Ellipse ein Kreis.
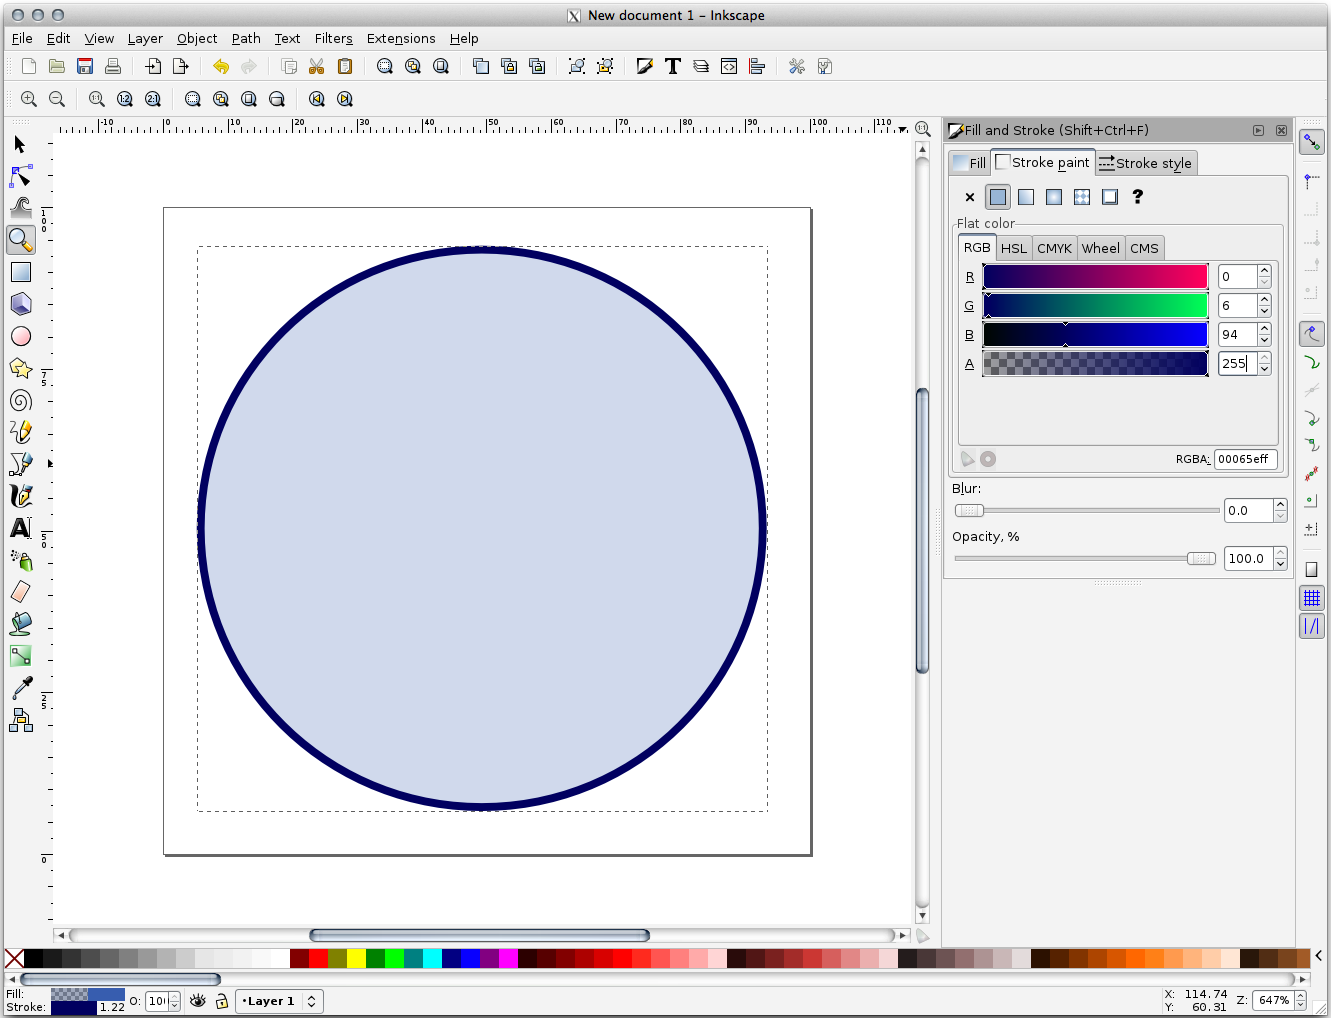
Klicken Sie mit der rechten Maustaste auf den Kreis und öffnen Sie den Eintrag Füllung und Kontur. Sie können die Darstellung verändern, z.B. so:
Ändern Sie die Farbe der Füllung auf ein blasses Graublau,
weisen Sie der Kontur im Tab Farbe der Kontur eine dunklere Farbe zu,
und verringern Sie die Breite der Kontur im Tab Muster der Kontur.
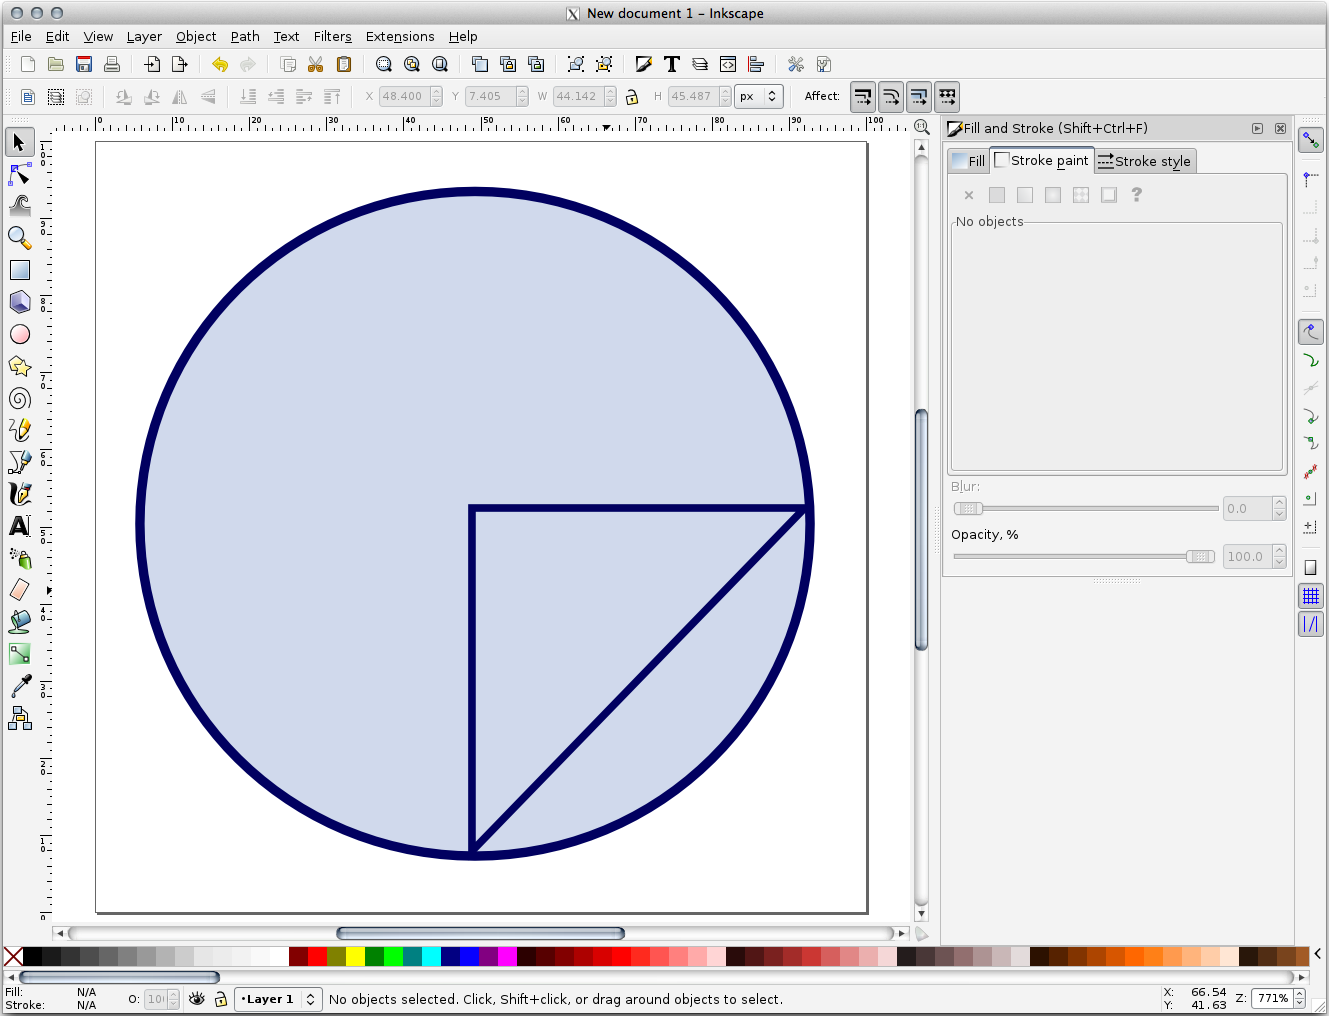
Zeichnen Sie eine Linie mit dem Freihandwerkzeug:
Starten Sie die Linie mit dem ersten Klick. Halten Sie Strg gedrückt, damit sie auf 15-Grad-Schritte einrastet.
Bewegen Sie den Mauszeiger waagrecht und setzen Sie einen Punkt mit einem weiteren Klick.
Klicken Sie und rasten Sie auf dem Stützpunkt der Linie ein. Zeichnen Sie eine senkrechte Linie und beenden Sie sie mit einem weitern Klick.
Verbinden Sie jetzt die Endpunkte der beiden Linien.
Ändern Sie Farbe und Strichbreite des Dreiecks passend zur Kontur des Kreises und schieben Sie es nach Bedarf herum, so dass Sie am Ende ungefähr so ein Symbol erhalten:
Wenn Sie mit dem Ergebnis zufrieden sind, speichern Sie es unter
landuse_symbolim Kursverzeichnis, unterexercise_data/symbolsals SVG-Datei.
In QGIS:
Öffnen Sie die Layereigenschaften des Layers
landuse.Ändern Sie den Symbollayertyp im Tab
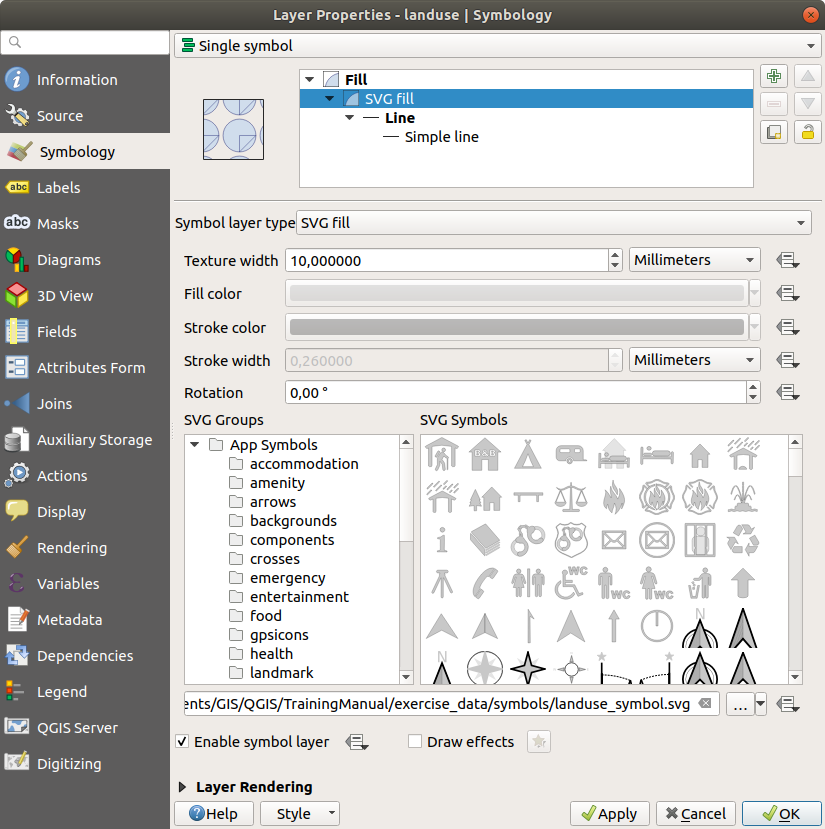
 Symbolisierung wie unten gezeigt auf SVG-Füllung.
Klicken Sie auf die Schaltfläche … und dann auf :guilabel:`Datei wählen…`und wählen Sie Ihr SVG-Bild aus.
Das Bild wird den SVG-Bildern hinzugefügt und nun können Sie seine verschiedenen Eigenschaften anpassen (Farben, Winkel, Effekte, Einheiten…).
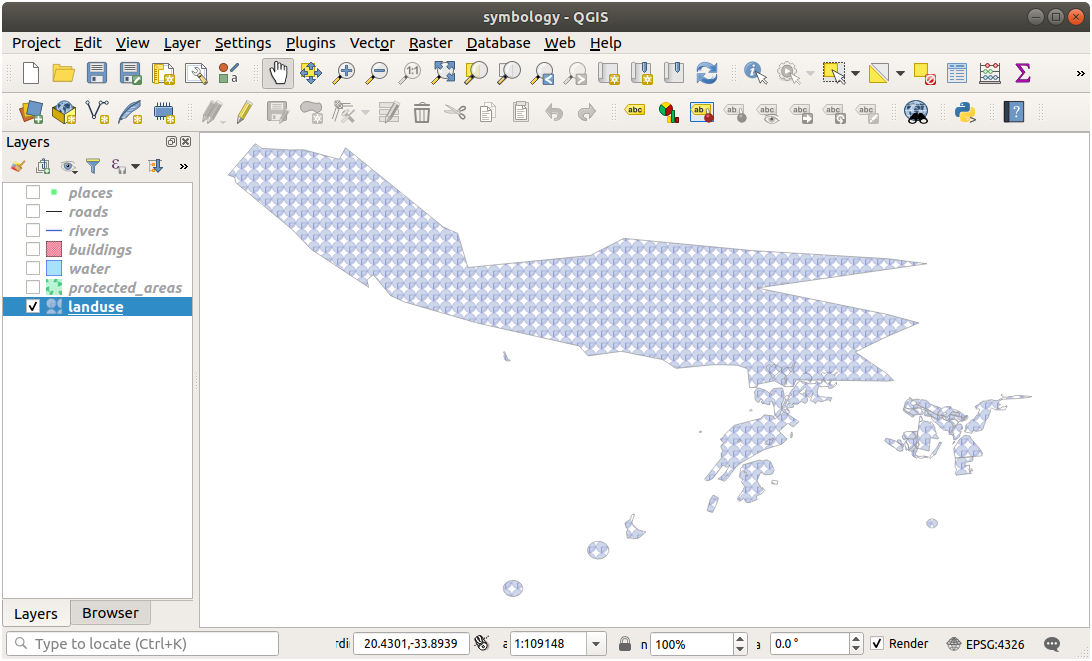
Sobald Sie den Dialog anwenden, sollte der Layer landuse mit Symbolen bedeckt sein und eine Textur ähnlich der in der folgenden Karte dargestellten aufweisen. Falls die Texturen nicht sichtbar sind, müssen Sie vielleicht in die Kartenansicht hineinzoomen oder in den Layereigenschaften eine größere Texturbreite einstellen.
2.4.15. ★★☆ Follow Along: Masking
Masking feature allows you to mask some symbol layer using another symbol layer or label.
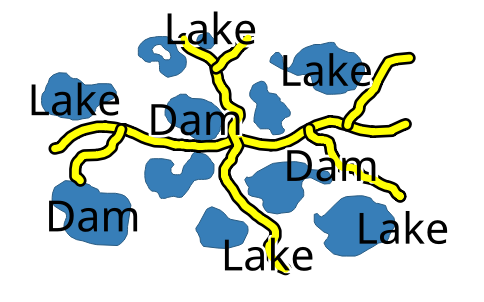
In the following exercise, we want to configure rendering so that polygon labels will mask the black part of lines layer.
Load the
selective_masking.qgsfrom dataset in directoryexercise_data/masking.Open the Layer Properties window for the
polyslayer.Under the
 Labels tab, you will see that
  Single Labels have
already been defined.
Single Labels have
already been defined.From the Labels tab, select the
 Mask (and not Masks in general category list)
Enable label mask by checking the
 Enable mask option
A message tells you that the now defined label mask shape can be later selected as a mask source to mask other symbol layers. Let’s do that.
Klicken Sie auf OK
Open the Layer Properties window for the
lineslayer.Click on the black line part of lines checkbox from masked symbol layers
A message warns you that you have to select both masking and masked symbol layers to be able to save masking configuration. Again, let’s do that.
Click on
polysLabel mask checkboxThe message disappears, you can now safely save your configuration.

Klicken Sie auf OK
You can see now that labels are masking the black part of lines, leaving only the yellow part.
2.4.16. ★★☆ Follow Along: Masking using points symbols
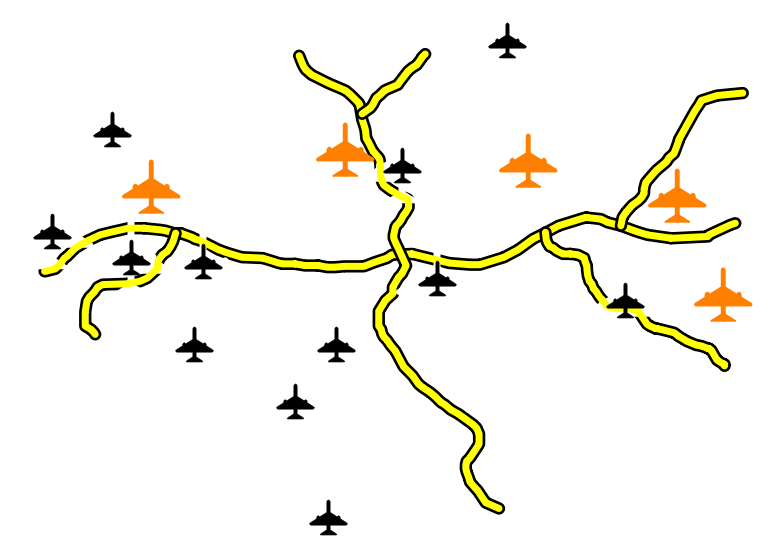
We want now to mask the black part of lines using only black planes that represent the points layer (i.e. B52 and Jet points categories).
For the sake of visibility, you can switch off polys layer visibility.
Open the Layer Properties window for the
pointslayer.Under the
 Symbology tab, you will see that a
  Categorized renderer has
been defined with 3 different symbols depending on the
 Classfield value.Double click on
B52plane icon, within the Symbol column
Click the
 Add symbol layer button and select the
 MaskSymbol layer typeA new hierarchy
Mask(symbol layer) >Marker(symbol) >Simple Marker(symbol layer) appear below the root symbolMarker.
Now, let’s define a mask that is identical to our plane marker but a little bit bigger.
Select the newly created
Simple Markersymbol layer and change its Symbol layer type toSVG markerSet the SVG file path to be the same as the already existing SVG marker, and the size to be bigger (24 millimeters is a pretty good choice for this use case).
Mask color doesn’t matter here, only the shape is used in masking. Symbol layer order is also irrelevant in that situation.
You should get something like that:

Repeat the same operations on
Jetsymbol.Klicken Sie auf OK
Open the Layer Properties window for the
lineslayer.-
The black line part of lines checkbox from masked symbol layers is already checked from our previous configuration.
Uncheck the Label mask
polyscheckbox and check bothB52andJetMask symbol layerKlicken Sie auf OK
You now see that black planes are masking the black part of lines, with only the yellow part visible.
2.4.17. Zusammenfassung
Durch die Änderung der Darstellung der verschiedenen Layer wurde einige Vektordateien in eine lesbare Karte verwandelt. Sie können nicht nur sehen, was passiert, sondern es ist sogar hübsch anzusehen!
2.4.18. Weiterlesen
2.4.19. Was kommt als Nächstes?
Die Symbolisierung ganzer Layer zu ändern ist nützlich, allerdings ist so die in jedem der Layer enthaltene Information einem Leser dieser Karten nicht zugänglich. Wie heißen die Straßen? Zu welchen Verwaltungseinheiten gehören bestimmte Gebiete? Wie groß sind die landwirtschaftlichen Flächen der Betriebe im Verhältnis zueinander? All diese Informationen sind immer noch verborgen. Die nächste Lektion wird Ihnen erklären, wie Sie diese auf Ihrer Karte darstellen.
Bemerkung
Hatten Sie Ihre Karte eigentlich gespeichert?


