Importante
A tradução é um esforço comunitário você pode contribuir. Esta página está atualmente traduzida em 33.96%.
3.1. Lesson: Vector Attribute Data
Vector data is arguably the most common kind of data in the daily use of GIS. The vector model represents the location and shape of geographic features using points, lines and polygons (and for 3D data also surfaces and volumes), while their other properties are included as attributes (often presented as a table in QGIS).
Até agora, nenhuma das alterações que fizemos para o mapa foram influenciadas pelos objetos que estão sendo mostrados. Em outras palavras, todas as áreas urbanas são parecidas, e todas as estradas parecem iguais. Ao olhar para o mapa, os espectadores não sabem nada sobre as estradas que estão vendo; apenas que existe uma estrada de uma determinada forma numa determinada área.
Mas a força do SIG é que todos os objetos que são visíveis no mapa também têm atributos. Mapas em um SIG não são apenas imagens. Eles representam não apenas os objetos em locais, mas também informações sobre esses objetos.
O objetivo desta lição: aprender sobre a estrutura de dados vetoriais e explorar os dados de atributo de um objeto
3.1.1. ★☆☆ Follow Along: Viewing Layer Attributes
É importante saber que os dados que você estará trabalhando não representam apenas onde os objetos estão no espaço, mas também te diz o que esses objetos são.
From the previous exercise, you should have the protected_areas layer
loaded in your map. If it is not loaded, then you can find the
protected_areas.shp ESRI Shapefile format dataset in directory
exercise_data/shapefile.
Os polígonos que representam as áreas protegidas constituem os dados espaciais, mas podemos aprender mais sobre as áreas protegidas explorando a tabela de atributos.
In the Layers panel, click on the
protected_areaslayer to select it.In the menu, click the
 Open Attribute Table button (also accessible from top toolbars buttons).
This will open a new window showing the attribute table of the
Open Attribute Table button (also accessible from top toolbars buttons).
This will open a new window showing the attribute table of the protected_areaslayer.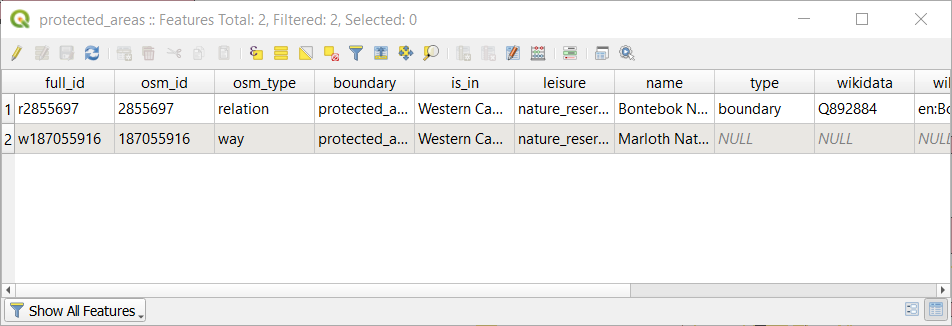
A row is called a record and is associated with a feature in the Canvas Map, such as a polygon. A column is called a field (or an attribute), and has a name that helps describe it, such as
nameorid. Values in the cells are known as attribute values. These definitions are commonly used in GIS, so it is good to become familiar with them.In the
protected_areaslayer, there are two features, which are represented by the two polygons we see on the Map Canvas.Nota
In order to understand what the fields and attribute values represent, one may need to find documentation (or metadata) describing the meaning of the attribute values. This is usually available from the creator of the data set.
Next, let’s see how a record in the attribute table is linked to a polygon feature that we see on the Map Canvas.
Voltar para a janela principal do QGIS.
In the menu, click on the
 Select Feature(s) button.
Make sure the
protected_areaslayer is still selected in the Layers panel.Move your mouse to the Map Canvas and left click on the smaller of the two polygons. The polygon will turn yellow indicating it is selected.
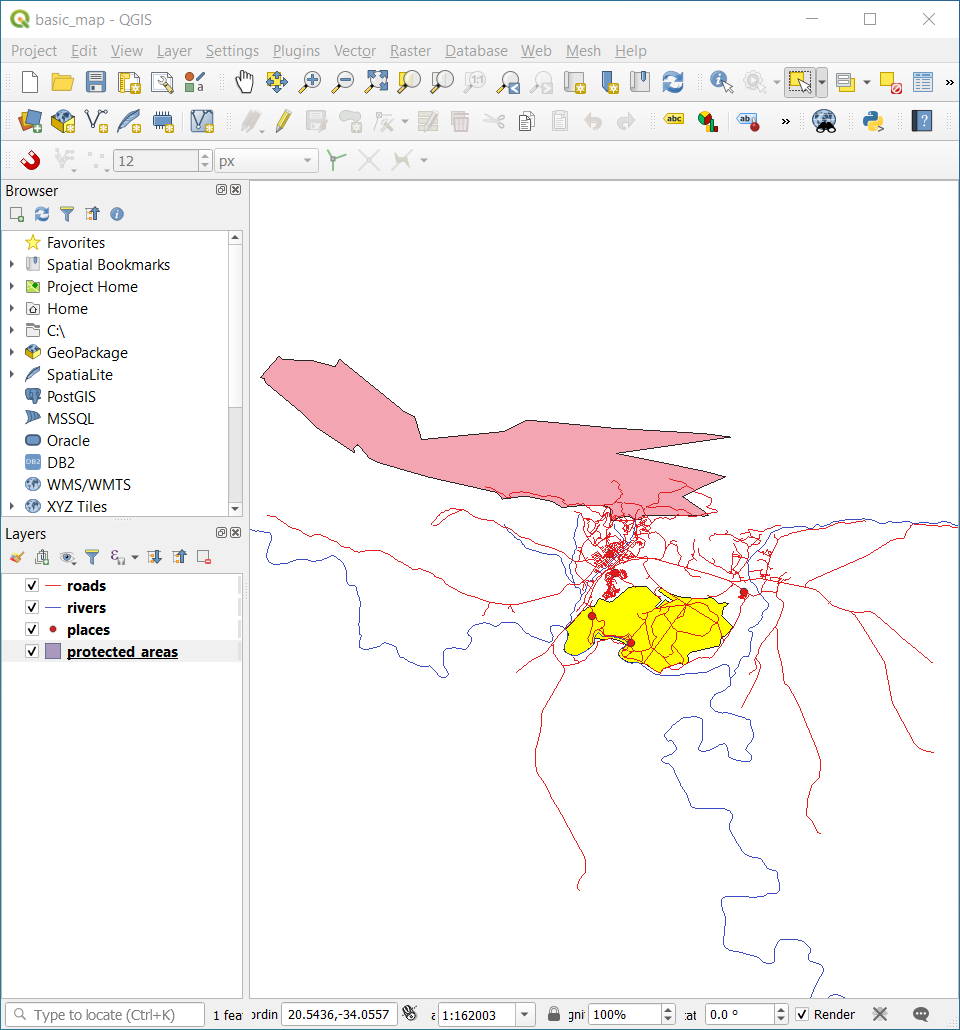
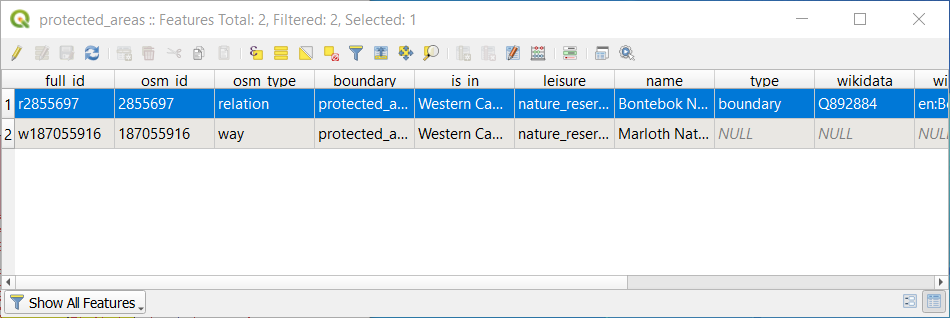
Go back to the Attribute Table window, and you should see a record (row) highlighted. These are the attribute values of the selected polygon.
Você também pode selecionar uma feição usando a Tabela de Atributos.
In the Attribute Table window, on the far left, click on the row number of the record that is currently not selected.
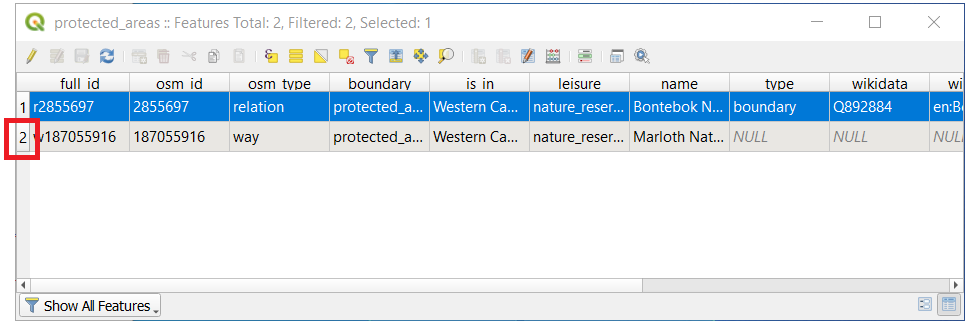
Go back to the main QGIS window and look at the Map Canvas. You should see the larger of the two polygons colored yellow.
To deselect the feature, go to the Attribute Table window and click on
 Deselect all features from the layer button.
Sometimes there are many features shown on the Map Canvas and it might be difficult to see which feature is selected from the Attribute Table. Another way to identify the location of a feature is to use the Flash Feature tool.
In the Attribute Table, right-click on any cell in the row that has the attribute value
r2855697for the fieldfull_id.In the context menu, click on Flash Feature and watch the Map Canvas.
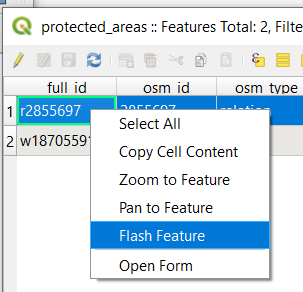
Você deverá ver o polígono piscar em vermelho algumas vezes. Se você perdeu, tente novamente.
Another useful tool is the Zoom to Feature tool, that tells QGIS to zoom to the feature of interest.
In the Attribute Table, right-click on any cell in the row that has the attribute value
r2855697for the fieldfull_id.In the context menu, click on Zoom to Feature
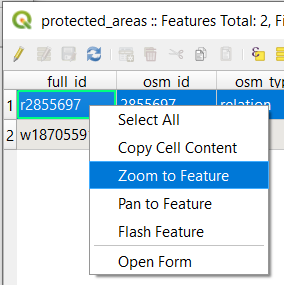
Look at the Map Canvas. The polygon should now occupy the extent of the Map Canvas area.
Agora você pode fechar a tabela de atributos.
3.1.2. ★☆☆ Try Yourself: Exploring Vector Data Attributes
How many fields are available in the
riverslayer?Conte-nos um pouco sobre os locais da
cidadeno seu conjunto de dados.Open the attribute table for the
placeslayer. Which field would be the most useful to represent in label form, and why?
Responda
There should be 9 fields in the
riverslayer:Select the layer in the Layers panel.
Right-click and choose Open Attribute Table, or press the
button on the Attributes Toolbar
(it can be enabled from menu).Contar o número de colunas.
A quicker approach could be to double-click the
riverslayer, open the tab, where you will find a numbered list of the table’s fields.Information about towns is available in the
placeslayer. Open its attribute table as you did with theriverslayer: there are two features whose place attribute is set totown: Swellendam and Buffeljagsrivier. You can add comment on other fields from these two records, if you like.The
namefield is the most useful to show as labels. This is because all its values are unique for every object and are very unlikely to contain NULL values. If your data contains some NULL values, do not worry as long as most of your places have names.
3.1.3. In Conclusion
Você já sabe como usar a tabela de atributos para ver o que são realmente os dados que você está usando. Qualquer conjunto de dados só será útil para você se ele tiver atributos do seu interesse. Se você sabe quais os atributos que você precisa, você pode decidir rapidamente se você poderá usar um determinado conjunto de dados, ou se você precisa procurar por outro que tenha os atributos necessários.
3.1.4. What’s Next?
Atributos diferentes são úteis para diferentes objetivos. Alguns podem estar representados diretamente como texto para ser visto pelo usuário. Você aprenderá como fazer isso na próxima lição.