The Map Item
Click on the  Add new map toolbar button in the Print Composer
toolbar to add the QGIS map canvas. Now, drag a rectangle onto the Composer
canvas with the left mouse button to add the map. To display the current map, you
can choose between three different modes in the map Item Properties
panel:
Add new map toolbar button in the Print Composer
toolbar to add the QGIS map canvas. Now, drag a rectangle onto the Composer
canvas with the left mouse button to add the map. To display the current map, you
can choose between three different modes in the map Item Properties
panel:
- Rectangle is the default setting. It only displays an empty box with a
message ‘Map will be printed here’.
- Cache renders the map in the current screen resolution. If you zoom the
Composer window in or out, the map is not rendered again but the image will
be scaled.
- Render means that if you zoom the Composer window in or out, the map will
be rendered again, but for space reasons, only up to a maximum resolution.
Cache is the default preview mode for newly added Print Composer maps.
You can resize the map item by clicking on the  Select/Move item
button, selecting the element, and dragging one of the blue handles in the
corner of the map. This button also helps to move the map to another place.
Select the item and while holding the left mouse button, move to the new place
and release the mouse button. After you have found the right place for an item,
you can lock the item position within the Print Composer canvas. Select the
map item and use the toolbar
Select/Move item
button, selecting the element, and dragging one of the blue handles in the
corner of the map. This button also helps to move the map to another place.
Select the item and while holding the left mouse button, move to the new place
and release the mouse button. After you have found the right place for an item,
you can lock the item position within the Print Composer canvas. Select the
map item and use the toolbar  Lock Selected Items or the
panel to Lock the item. A locked item can only be selected
using the panel. Once selected you can use the
panel to unlock individual items. The
Lock Selected Items or the
panel to Lock the item. A locked item can only be selected
using the panel. Once selected you can use the
panel to unlock individual items. The  Unlock All Items icon will unlock all locked composer items. With the
map selected, you can now adapt more properties in the map
Item Properties panel.
Unlock All Items icon will unlock all locked composer items. With the
map selected, you can now adapt more properties in the map
Item Properties panel.
To move layers within the map element, select the map element, click the
 Move item content icon and move the layers within
the map item frame with the left mouse button.
Move item content icon and move the layers within
the map item frame with the left mouse button.
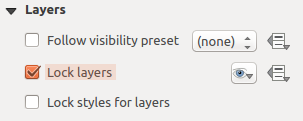
The Layers dialog of the map item panel provides the following
functionality (see figure_composer_map_layers):
If you want to keep the map item constantly updated
with a visibility preset, use the  Follow
visibility preset and set the preset you want. Any changes applied to the
preset in QGIS’s main window (using the replace preset) will also show in the
map item. In this case, the Lock styles for layers option will
be disabled because Follow visibility preset also updates the
style (symbology, label, diagram) of the visibility preset layers.
Follow
visibility preset and set the preset you want. Any changes applied to the
preset in QGIS’s main window (using the replace preset) will also show in the
map item. In this case, the Lock styles for layers option will
be disabled because Follow visibility preset also updates the
style (symbology, label, diagram) of the visibility preset layers.
To lock the layers shown on a map item to the current map canvas check
 Lock layers. After this option is enabled, any
changes on the layers visibility in the QGIS’s main window won’t affect
the Composer’s map item. Nevertheless, style and labels of locked
layers are still refreshed according to QGIS’s main window.
You can prevent this by using Lock styles for layers.
Lock layers. After this option is enabled, any
changes on the layers visibility in the QGIS’s main window won’t affect
the Composer’s map item. Nevertheless, style and labels of locked
layers are still refreshed according to QGIS’s main window.
You can prevent this by using Lock styles for layers.
Using the  button, you can lock the map item’s layers to one of
the visibility presets you have prepared in QGIS (see Layers Panel to
find out how to create visibility presets).
Clicking the button will show the list of all the preset
views. Select the preset you want to display. The map canvas will lock the
preset layers automatically by enabling the Lock
layers. You can release the preset by unchecking the
Lock layers and press the
button, you can lock the map item’s layers to one of
the visibility presets you have prepared in QGIS (see Layers Panel to
find out how to create visibility presets).
Clicking the button will show the list of all the preset
views. Select the preset you want to display. The map canvas will lock the
preset layers automatically by enabling the Lock
layers. You can release the preset by unchecking the
Lock layers and press the  button in the
map composer’s Navigation toolbar.
button in the
map composer’s Navigation toolbar.
Note that, unlike the Follow visibility preset, using the
Lock layers option enabled and set to a preset, the map item
layers won’t be updated if the preset is changed (using the replace preset
option) in QGIS’s main window.
Locked layers in the map can also be data-defined, using
the  icon beside the option. When used, this overrides the
selection set in the drop-down list. You need to pass a list of layers
separated by | character.
The following example locks the map item to use only layers layer 1 and
layer 2:
icon beside the option. When used, this overrides the
selection set in the drop-down list. You need to pass a list of layers
separated by | character.
The following example locks the map item to use only layers layer 1 and
layer 2:
concat ('layer 1', '|', 'layer 2')
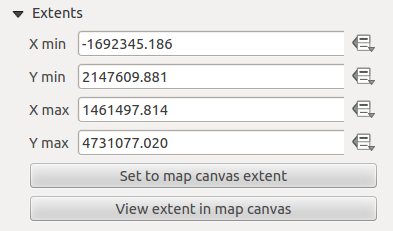
The Extents dialog of the map item panel provides the following
functionalities (see figure_composer_map_extents):
The Map extents area allows you to specify the map extent using X and
Y min/max values and by clicking the [Set to map canvas extent] button.
This button sets the map extent of the composer map item to the extent of the
current map view in the main QGIS application.
The button [View extent in map canvas] does exactly the opposite; it
updates the extent of the map view in the QGIS application to the extent
of the composer map item.
If you change the view on the QGIS map canvas by changing
vector or raster properties, you can update the Print Composer view by selecting
the map element in the Print Composer and clicking the [Update preview]
button in the map Item Properties panel (see figure_composer_map).
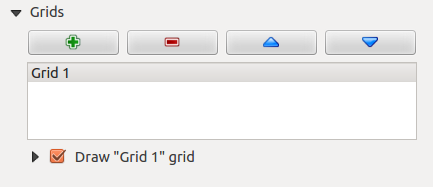
The Grids dialog of the map Item Properties panel
provides the possibility to add several grids to a map item.
- With the
 and
and  buttons you can add or remove a selected
grid.
buttons you can add or remove a selected
grid.
- With the
 and
and  buttons you can move a grid in the list
and set the drawing priority.
buttons you can move a grid in the list
and set the drawing priority.
When you double-click the added grid you can give it another name.
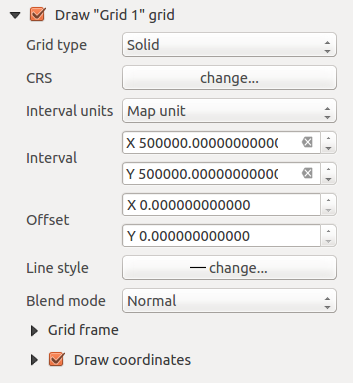
After you have added a grid, you can activate the checkbox
Draw grid to overlay a grid onto the map element. Expand this option
to provide a lot of configuration options, see Figure_composer_map_grid_draw.
As grid type, you can specify to use a ‘Solid’, ‘Cross’, ‘Markers’ or ‘Frame and
annotations only’.
‘Frame and annotations only’ is especially useful when working with rotated maps
or reprojected grids. In the divisions section of the Grid Frame Dialog mentioned
below you then have a corresponding setting. Symbology of the grid and its
rendering mode can be chosen. See Rendering mode. Furthermore,
you can define an interval in the X and Y directions, an X and Y offset,
and the width used for the cross or line grid type.
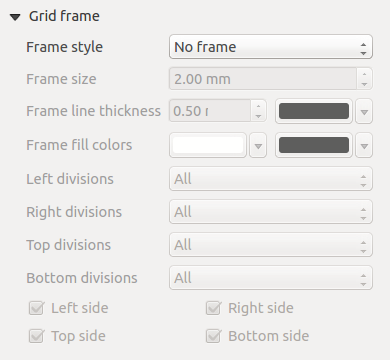
- There are different options to style the frame that holds the map.
Following options are available: No Frame, Zebra, Interior ticks, Exterior
ticks, Interior and Exterior ticks and Lineborder.
- With ‘Latitude/Y only’ and ‘Longitude/X only’ setting in the divisions section
you have the possibility to prevent a mix of latitude/y and longitude/x
coordinates showing on a side when working with rotated maps or reprojected
grids.
- Advanced rendering mode is also available for grids.
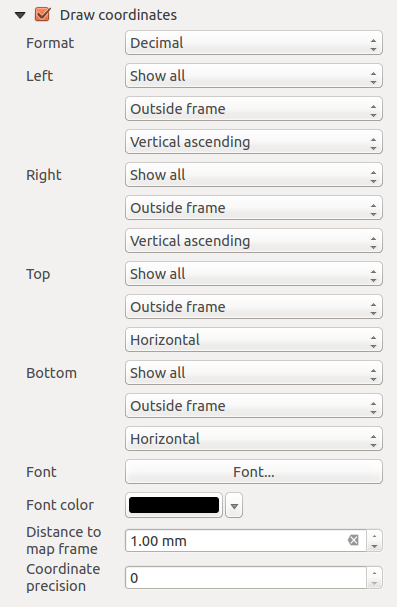
- The Draw coordinates checkbox allows you to add
coordinates to the map frame. You can choose the annotation numeric format,
the options range from decimal to degrees, minute and seconds, with or without
suffix, aligned or not and a custom format using the expression dialog.
You can choose which annotation to show. The options are: show all, latitude
only, longitude only, or disable(none). This is useful when the map is rotated.
The annotation can be drawn inside or outside the map frame. The annotation
direction can be defined as horizontal, vertical ascending or vertical
descending. Finally, you can define the annotation font, the annotation font
color, the annotation distance from the map frame and the precision of the
drawn coordinates.
The Overviews dialog of the map Item Properties panel
provides the following functionalities:
You can choose to create an overview map, which shows the extents of the other
map(s) that are available in the composer. First you need to create the map(s)
you want to include in the overview map and the map you want to use as the
overview map, just like a normal map.
Then expand Overviews option and press the green plus icon-button to
add an overview.
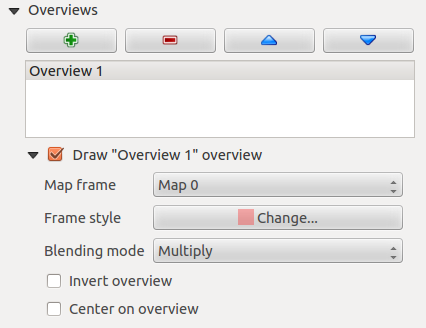
Initially this overview is named ‘Overview 1’ (see Figure_composer_map_overview).
You can change the name when you double-click on the overview item in the list
named ‘Overview 1’ and change it to another name.
- With the plus and minus button you can add or remove an overview.
- With the up and down button you can move an overview in the list and set the
drawing priority.
When you select the overview item in the list you can customize it.
- The Draw “<name_overview>” overview needs to be
activated to draw the extent of selected map frame.
- The Map frame combo list can be used to select the map item whose
extents will be drawn on the present map item.
- The Frame Style allows you to change the style of the overview frame.
- The Blending mode allows you to set different transparency blend modes.
- The Invert overview creates a mask around the extents when
activated: the referenced map extents are shown clearly, whereas everything else
is blended with the frame color.
- The Center on overview puts the extent of the overview
frame in the center of the overview map. You can only activate one overview
item to center, when you have added several overviews.
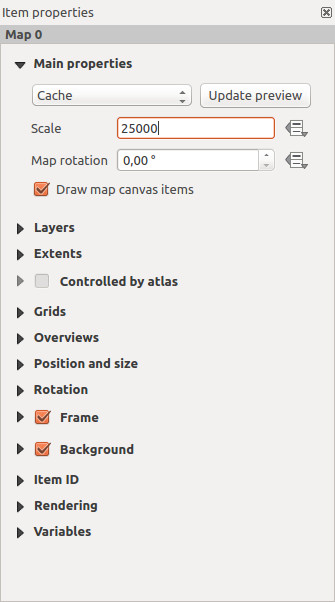
 manually sets the map item scale.