` `
Модуль «Теплокарт໶
The Heatmap plugin uses Kernel Density Estimation to create a density (heatmap) raster of an input point vector layer. The density is calculated based on the number of points in a location, with larger numbers of clustered points resulting in larger values. Heatmaps allow easy identification of “hotspots” and clustering of points.
Активация модуля
First this core plugin needs to be activated using the Plugin Manager (see
The Plugins Dialog). After activation, the heatmap icon  can be found in the Raster Toolbar, and under the Raster ‣ Heatmap
menu.
can be found in the Raster Toolbar, and under the Raster ‣ Heatmap
menu.
Если кнопки не видно, возможно, у вас отключена соответствующая панель инструментов. Включить её можно из меню Вид ‣ Панели инструментов ‣ Растр.
Использование модуля
Clicking the Heatmap tool button opens the Heatmap plugin dialog
(see figure_heatmap_settings).
Для построения теплокарты необходимо задать следующие параметры:
- Input point layer: Lists all the vector point layers in the current project and is used to select the layer to be analysed.
- Output raster: Allows you to use the
 button to select the folder and
filename for the output raster the Heatmap plugin generates. A file extension
is not required.
button to select the folder and
filename for the output raster the Heatmap plugin generates. A file extension
is not required. - Output format: Selects the output format. Although all formats supported by GDAL can be chosen, in most cases GeoTIFF is the best format to choose.
- Radius: Is used to specify the heatmap search radius (or kernel bandwidth) in meters or map units. The radius specifies the distance around a point at which the influence of the point will be felt. Larger values result in greater smoothing, but smaller values may show finer details and variation in point density.
When the  Advanced checkbox is checked, additional options
will be available:
Advanced checkbox is checked, additional options
will be available:
- Rows and Columns: Used to change the dimensions of the output raster. These values are also linked to the Cell size X and Cell size Y values. Increasing the number of rows or columns will decrease the cell size and increase the file size of the output file. The values in Rows and Columns are also linked, so doubling the number of rows will automatically double the number of columns and the cell sizes will also be halved. The geographical area of the output raster will remain the same!
- Cell size X and Cell size Y: Control the geographic size of each pixel in the output raster. Changing these values will also change the number of Rows and Columns in the output raster.
- Kernel shape: The kernel shape controls the rate at which the influence of a point decreases as the distance from the point increases. Different kernels decay at different rates, so a triweight kernel gives features greater weight for distances closer to the point then the Epanechnikov kernel does. Consequently, triweight results in “sharper” hotspots, and Epanechnikov results in “smoother” hotspots. A number of standard kernel functions are available in QGIS, which are described and illustrated on Wikipedia.
- Decay ratio: Can be used with Triangular kernels to further control how heat from
a feature decreases with distance from the feature.
- A value of 0 (=minimum) indicates that the heat will be concentrated in the centre of the given radius and completely extinguished at the edge.
Коэффициент равный 0.5 означает, что температура пикселей на краях буферной зоны будет в два раза ниже температуры в центре.
Если указано значение 1, распределение температуры будет равномерным по всей буферной зоне (это равнозначно использованию «Прямоугольной» функции ядра).
- A value greater than 1 indicates that the heat is higher towards the edge of the search radius than at the centre.
Исходный точечный слой может содержать поля, которые можно использоваться при построении теплокарты:
- Use radius from field: Sets the search radius for each feature from an attribute field in the input layer.
- Use weight from field: Allows input features to be weighted by an attribute field. This can be used to increase the influence certain features have on the resultant heatmap.
Когда все параметры указаны, нажмите кнопку [OK], чтобы запустить процесс создания теплокарты.
Пример создания теплокарты
For the following example, we will use the airports vector point layer from the QGIS sample dataset (see Sample Data). Another excellent QGIS tutorial on making heatmaps can be found at http://www.qgistutorials.com.
In Figure_Heatmap_data, the airports of Alaska are shown.
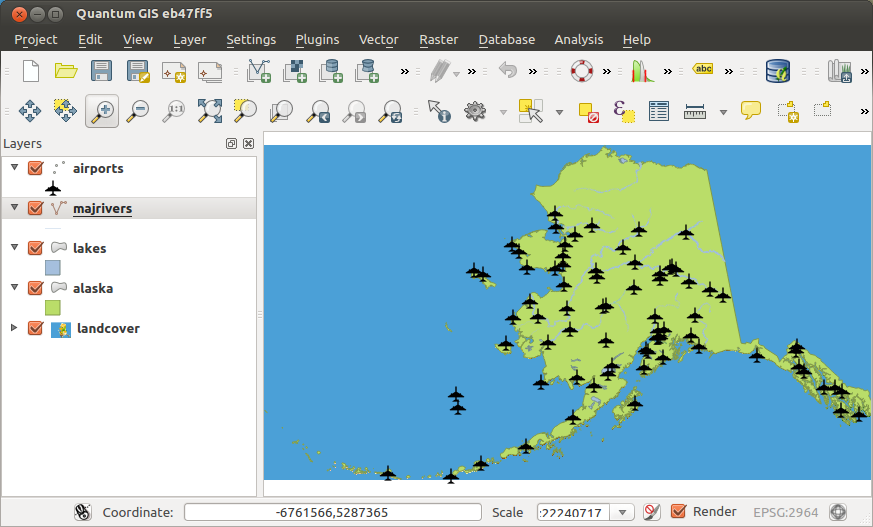
Airports of Alaska
- Select the Heatmap tool button to open the Heatmap dialog
(see Figure_Heatmap_settings).
- In the Input point layer
 field, select airports
from the list of point layers loaded in the current project.
field, select airports
from the list of point layers loaded in the current project. - Specify an output filename by clicking the button next to the
Output raster field. Enter the filename heatmap_airports (no
file extension is necessary).
В выпадающем списке Формат вывода
выберите GeoTiff.Установите в поле Радиус значение 1000000 метров.
- Click on [OK] to create and load the airports heatmap (see Figure_Heatmap_created).
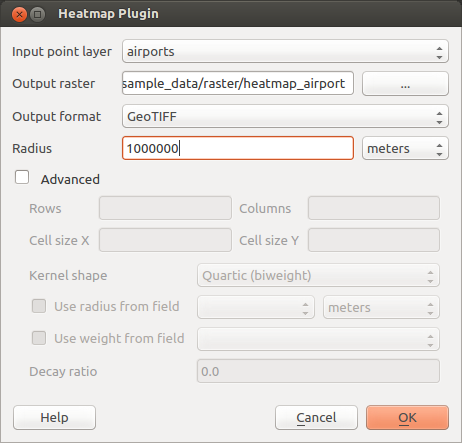
The Heatmap Dialog
QGIS will generate the heatmap and add the results to your map window. By default, the heatmap is shaded in greyscale, with lighter areas showing higher concentrations of airports. The heatmap can now be styled in QGIS to improve its appearance.
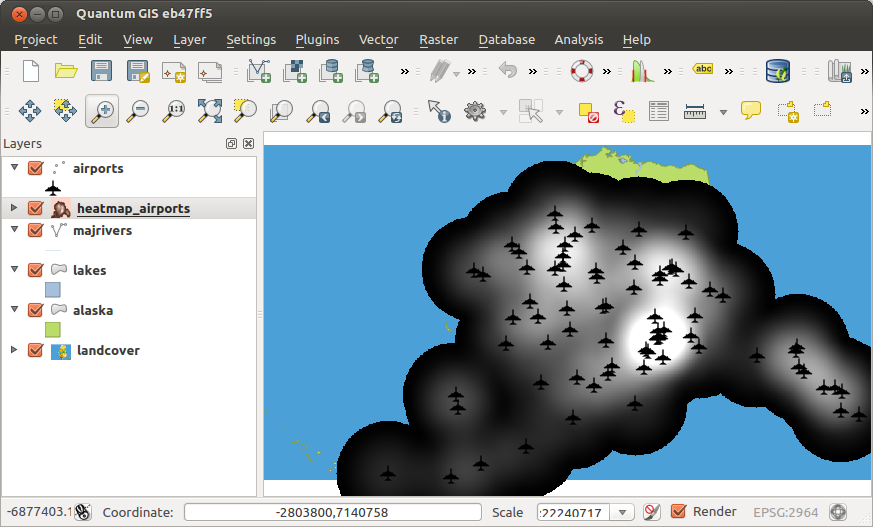
The heatmap after loading looks like a grey surface
Откройте свойства слоя heatmap_airports. Для этого выберите слой в списке слоёв проекта, вызовите контекстное меню по правой клавише мыши и выберите пункт Свойства.
Перейдите на вкладку Стиль.
- Change the Render type to ‘Singleband pseudocolor’.
- Select a suitable Color map , for instance YlOrRed.
Нажмите кнопку [Загрузить]**в группе :guilabel:`Значения мин/макс` для получения минимального и максимального значений растра. Затем нажмите кнопку **[Классифицировать] в группе Создать цветовую карту.
Нажмите кнопку [OK] чтобы закрыть окно и применить настройки отображения растра.
The final result is shown in Figure_Heatmap_styled.
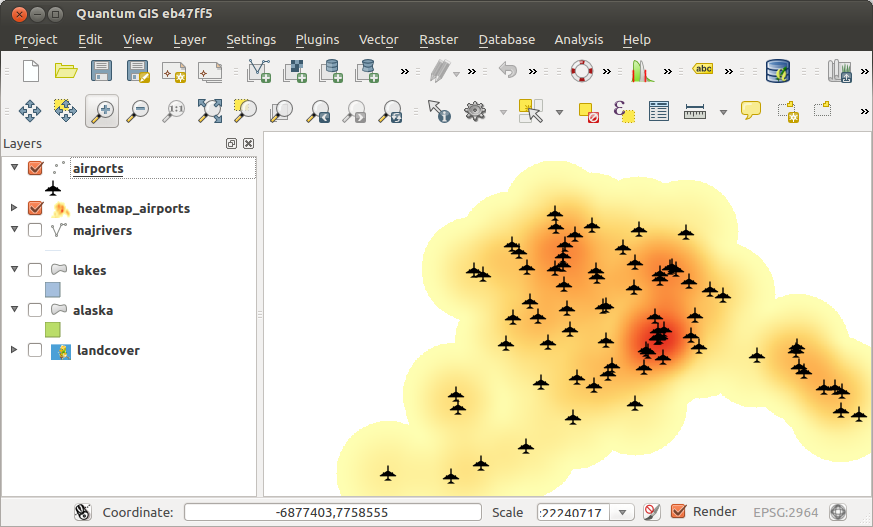
Styled heatmap of airports of Alaska