15.7. Lesson: De parameters voor het bos berekenen
Het bepalen van de parameters van het bos is het doel van de inventarisatie van het bos. In aansluiting op het voorbeeld uit de vorige les, zult u de in het veld verzamelde informatie van de inventarisatie gaan gebruiken om de parameters voor het bos te berekenen, eerst voor het gehele bos, en dan voor de bosopstanden die u eerder digitaliseerde.
Het doel voor deze les: Parameters voor het bos berekenen, voor het geheel en op niveau van bosopstand.
15.7.1.  Follow Along: De resultaten van de inventarisatie toevoegen
De teams in het veld hebben het bos bezocht en, met behulp van de informatie die u heeft verschaft, informatie over het bos verzameld op elke monsterplaats.
Most often the information will be collected into paper forms in the field, then typed to a spreadsheet. The sample plots information has been condensed into a .csv file that can be easily open in QGIS.
Continue with the QGIS project from the lesson about designing the inventory, you probably named it forest_inventory.qgs.
Voeg als eerste de metingen van de monsterplaatsen toe aan uw project van QGIS:
Ga naar Laag ‣ Tekstgescheiden kaartlaag toevoegen....
- Browse to the file systematic_inventory_results.csv located in exercise_data\forestry\results\.
Zorg er voor dat de optie Puntcoördinaten is geselecteerd.
- Set the fields for the coordinates to the X and Y fields.
Klik op OK.
- When prompted, select ETRS89 / ETRS-TM35FIN as the CRS.
Open de Attributentabel voor de nieuwe laag en bekijk de gegevens.
You can read the type of data that is contained in the sample plots measurements in the text file legend_2012_inventorydata.txt located in the exercise_data\forestry\results\ folder.
The systematic_inventory_results layer you just added is actually just a virtual representation of the text information in the .csv file. Before you continue, convert the inventory results to a real shapefile:
- Right click on the systematic_inventory_results layer.
- Browse to exercise_data\forestry\results\ folder.
- Name the file sample_plots_results.shp.
Selecteer Voeg opgeslagen bestand toe aan kaart.
- Remove the systematic_inventory_results layer from your project.
15.7.2. Follow Along: Schatting voor parameters voor gehele bos
You can calculate the averages for this whole forest area from the inventory results for the some interesting parameters, like the volume and the number of stems per hectare. Since the systematic sample plots represent equal areas, you can directly calculate the averages of the volumes and number of stems per hectare from the sample_plots_results layer.
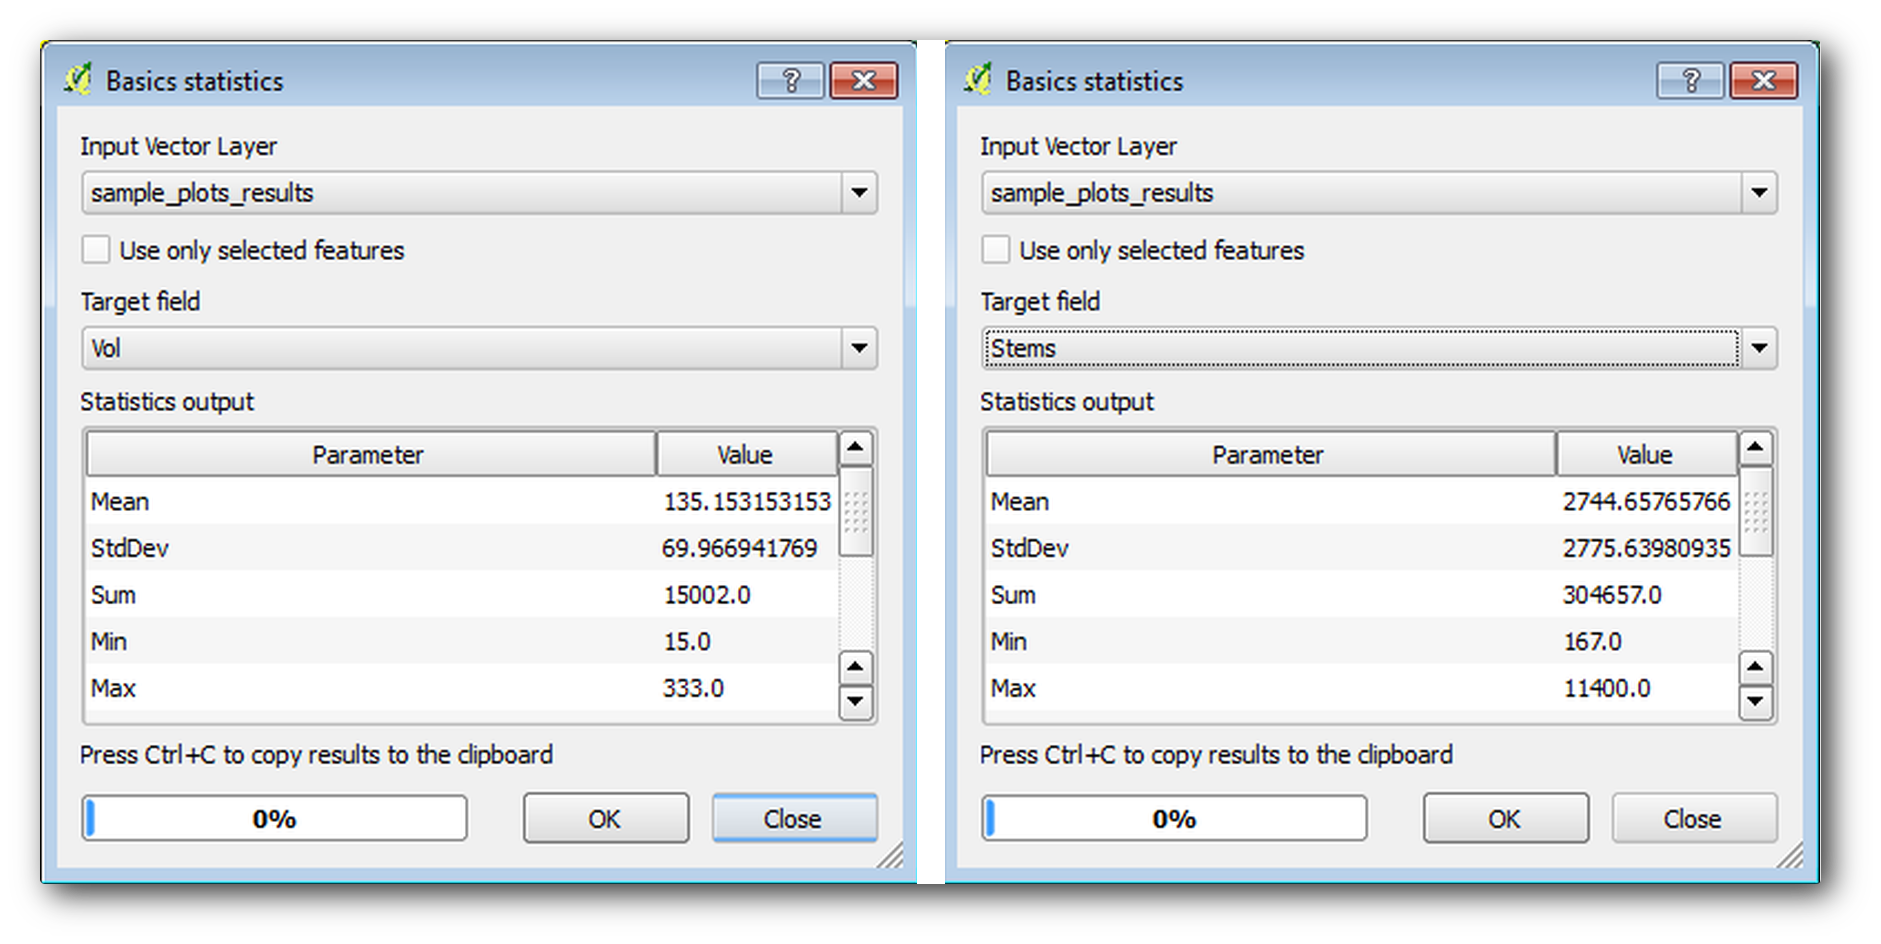
U kunt het gemiddelde van een veld in een vectorlaag berekenen met behulp van het gereedschap Basisstatistieken:
- Open Vector ‣ Analysis Tools ‣ Basic statistics.
- Select the sample_plots_results as the Input Vector Layer.
- Select Vol as Target field.
Klik op OK.
The average volume in the forest is 135.2 m3/ha.
You can calculate the average for the number of stems in the same way, 2745 stems/ha.
15.7.3. Follow Along: Parameters voor de bosopstanden schatten
U kunt gebruikmaken van deze zelfde systematische monsterplaatsen schattingen te berekenen voor de verschillende bosopstanden die u eerder digitaliseerde. Enkele van deze bosopstanden kregen geen monsterplaats en voor hen zult u dus geen informatie ontvangen. U zou enkele extra monsterplaatsen hebben kunnen plannen toen u de systematische inventarisatie plande, zodat de teams in het veld voor dit doel een paar extra monsterplaatsen zouden hebben bemeten. Of u zou later een team het veld ingestuurd kunnen hebben om schattingen voor de ontbrekende bosopstanden te verkrijgen om de inventarisatie van de bosopstanden te completeren. Niettegenstaande dat, u zult informatie verkrijgen voor een groot aantal bosopstanden door slechts gebruik te maken van de geplande monsterplaatsen.
Wat u nodig heeft zijn de gemiddelden van de monsterplaatsen die binnen elk van de bosopstanden vallen. Wanneer u informatie wilt combineren, gebaseerd op hun relatieve locaties, moet u een ruimtelijke join uitvoeren:
Open het gereedschap Vector ‣ Datamanagement-gereedschap ‣ Attributen op basis van plaats bijeenbrengen.
- Set forest_stands_2012 as the Target vector layer. The layer you want the results for.
- Set sample_plots_results as the Join vector layer. The layer you want to calculate estimates from.
Selecteer Samenvatting gebruiken van snijdende objecten.
Selecteer om alleen het Gemiddelde te berekenen.
- Name the result as forest_stands_2012_results.shp and save it in the exercise_data\forestry\results\ folder.
Selecteer tenslotte Alle rijen behouden..., zodat u later kunt controleren welke bosopstanden geen informatie kregen.
Klik op OK.
Accepteer, indien daarnaar gevraagd, het toevoegen van de nieuwe laag aan uw project.
Sluit het gereedschap Attributen op basis van plaats bijeenbrengen.
Open the Attribute table for forest_stands_2012_results and review the results you got. Note that a number of forest stands have NULL as the value for the calculations, those are the ones having no sample plots. Select them all review them in the map, they are some of the smaller stands:

Lets calculate now the same averages for the whole forest as you did before, only this time you will use the averages you got for the stands as the bases for the calculation. Remember that in the previous situation, each sample plot represented a theoretical stand of 80x80 m. Now you have to consider the area of each of the stands individually instead. That way, again, the average values of the parameters that are in, for example, m3/ha for the volumes are converted to total volumes for the stands.
U moet eerst de gebieden voor de bosopstanden berekenen en dan totale volumes en aantal stammen voor elk ervan berekenen:
Schakel, in de Atributentabel, Bewerken in.
Open de Veldberekening.
- Create a new field called area.
- Leave the Output field type to Decimal number (real).
- Set the Precision to 2.
- In the Expression box, write $area / 10000. This will calculate the area of the forest stands in ha.
Klik op OK.
Bereken nu een veld met de total volumes en geschatte anatal stammen voor elke bosopstand:
- Name the fields s_vol and s_stem.
De velden mogen gehele getallen zijn of u kunt ook real-getallen gebruiken.
- Use the expressions "area" * "MEANVol" and "area" * "MEANStems" for total volumes and total stems respectively.
Sla de wijzigingen op als u gereed bent.
Schakel Bewerken uit.
In de eerdere situatie waren de gebieden die door elke monsterplaats werden weergegeven hetzelfde, dus was het voldoende om het gemiddelde van de monsterplaatsen te berekenen. Voor het berekenen van de schattingen, moet u nu de som van het volume of het aantal stammen voor de bosopstand delen door de som van de gebieden van de bosopstanden die informatie bevatten.
- In the Attribute table for the forest_stands_2012_results layer, select all the stands containing information.
- Open Vector ‣ Analysis Tools ‣ Basic statistics.
- Select the forest_stands_2012_results as the Input Vector Layer.
- Select area as Target field.
- Check the Use only selected features
Klik op OK.

As you can see, the total sum of the stands’ areas is 66.04 ha. Note that the area of the missing forest stands is only about 7 ha.
In the same way, you can calculate that the total volume for these stands is 8908 m3/ha and the total number of stems is 179594 stems.
Het gebruiken van de informatie voor de bosopstanden, in plaats van die direct vanuit de monsterplaatsen te gebruiken, geeft de volgende schattingen voor de gemiddelden:
- 184.9 m3/ha and
- 2719 stems/ha.
Save your QGIS project, forest_inventory.qgs.
15.7.4. In Conclusion
U bent er in geslaagd schattingen voor het gehele bos te berekenen met behulp van de informatie uit uw systematische monsterplaatsen, eerst zonder de karakteristieken van het bos in overweging te nemen en ook met behulp van de interpretatie van de luchtfoto naar bosopstanden. En u heeft ook enige waardevolle informatie verkregen over de afzonderlijke bosopstanden, wat zou kunnen worden gebruikt om het beheer van het bos te plannen voor de komende jaren.
15.7.5. What’s Next?
In de volgende les zult u eerst een achtergrond met schaduw voor een heuvel maken vanuit een gegevensset van LiDAR die u zult gebruiken om een kaartweergave voor te bereidem met de resultaten voor het bos die u zojuist heeft berekend.