12.2. Lesson: Serving WMS
Let’s download the demo data and unzip the files in the qgis-server-tutorial-data subdirectory to any directory. We recommend that you simply create a /home/qgis/projects directory and put your files there in order to avoid possible permissions problems.
Le jeu de donnée contient un projet QGIS world.qgs, préparé pour être servi par QGIS Server. Si vous souhaitez utiliser votre propre projet ou apprendre comment préparer un projet, allez voir la section Prepare a project to serve.
Note
Ce module présente les URL afin que le public puisse facilement distinguer les paramètres et les valeurs des paramètres. Alors que le format normal est:
...&field1=value1&field2=value2&field3=value3
ce tutoriel utilise :
&field1=value1
&field2=value2
&field3=value3
Les coller dans Mozilla Firefox fonctionne parfaitement mais d’autres navigateurs internet comme Chrome peuvent ajouter des espaces indésirables entre les paires field:parameter. Ainsi, si vous rencontrez ce problème vous pouvez soit utiliser Firefox ou modifier les URL afin qu’il soit en format de ligne simple.
Let’s make a WMS GetCapabilities request in the web browser or with curl:
http://qgisplatform.demo/cgi-bin/qgis_mapserv.fcgi
?SERVICE=WMS
&VERSION=1.3.0
&REQUEST=GetCapabilities
&map=/home/qgis/projects/world.qgs
Dans la configuration Apache de la leçon précédente, la variable `` QGIS_PROJECT_FILE`` définit le projet par défaut à: file: / home / qgis / projects / world.qgs. Cependant, dans la demande ci-dessus, nous avons utilisé le paramètre ** map ** pour être explicite et pour montrer qu’il peut être utilisé pour pointer n’importe quel projet. Si vous supprimez le paramètre ** map ** de la demande ci-dessus, QGIS Server affichera la même réponse.
En interrogeant l’URL GetCapabilities avec un client WMS, celui-ci récupère en réponse un document XML contenant des métadonnées sur le serveur (quelles couches il contient, son emprise, les formats, la version WMS, etc.).
As QGIS is also a Client WMS / WMTS you can create a new WMS server connection with the help of the above GetCapabilities url. See the Lesson: Web Mapping Services or the Sélection des serveurs WMS/WMTS section on how to do it.
By adding the countries WMS layer to your QGIS project you should get an image like the one below:
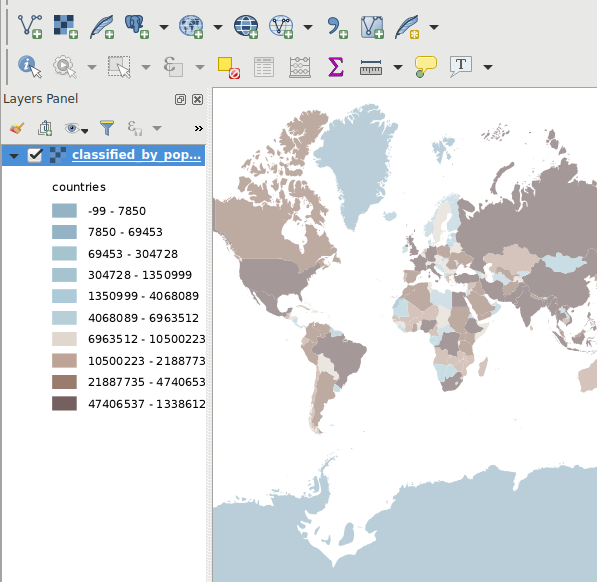
QGIS Desktop consuming the QGIS Server countries layer WMS service
Note
QGIS Server serves layers that are defined in the world.qgs project. By opening the project with QGIS you can see there are multiple styles for the countries layer. QGIS Server is also aware of this and you can choose the style you want in your request. The classified_by_population style was chosen in the above image.
12.2.1. Logging
When you’re setting up a server, the logs are always important as they show you what’s going on. We have setup in the *.conf file the following logs:
- QGIS Server log at /logs/qgisserver.log
- qgisplatform.demo Apache access log at qgisplatform.demo.access.log
- qgisplatform.demo Apache error log at qgisplatform.demo.error.log
The log files are simply text files so you can use a text editor to check them out. You can also use the tail command in a terminal: sudo tail -f /logs/qgisserver.log.
This will continuously output in the terminal what’s written in that log file. You can also have three terminals opened for each of the log files like so:
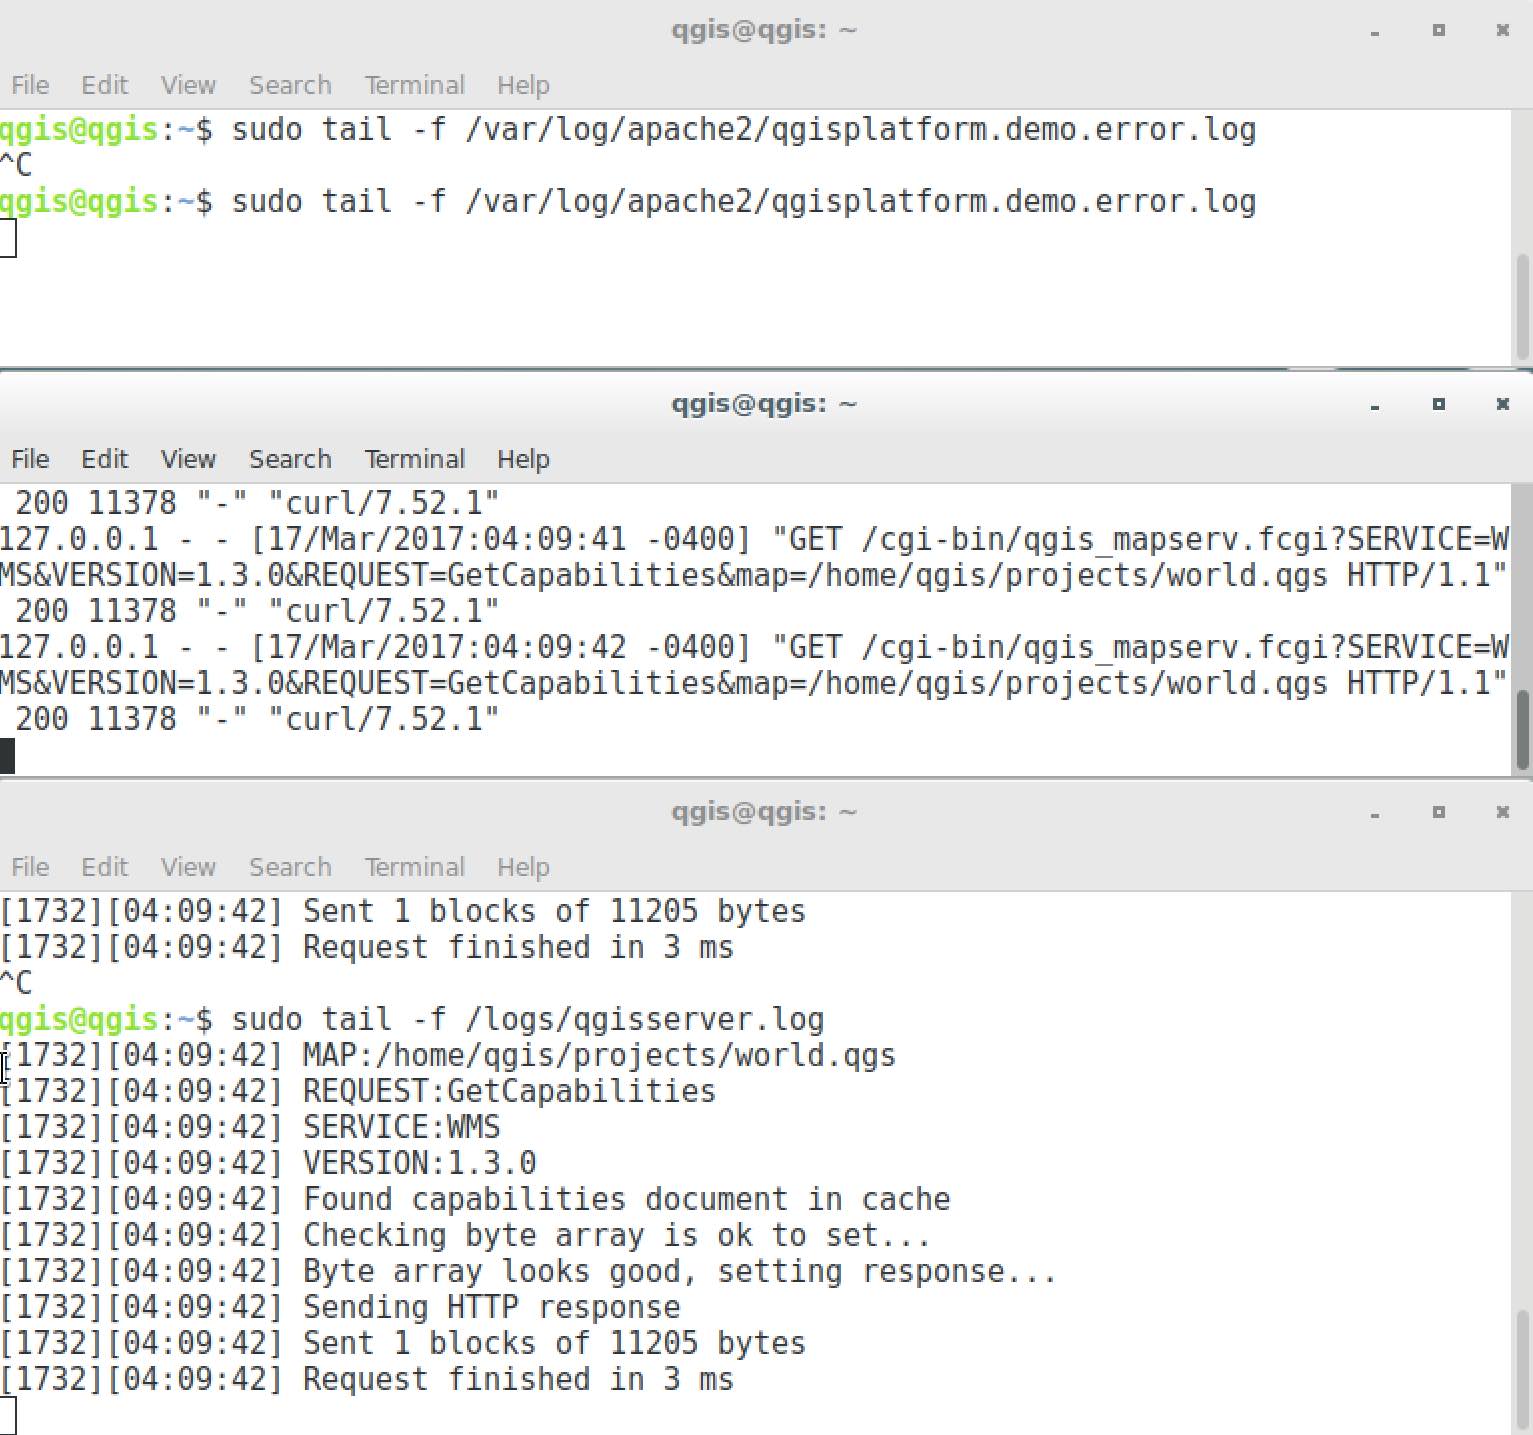
Using the tail command to visualise QGIS Server logs output
When you use QGIS Desktop to consume the QGIS Server WMS services you will see all the requests QGIS sends to the Server in the access log, the errors of QGIS Server in the QGIS Server log etc.
Note
- If you look at the logs in the following sections you should get a better understanding on what’s happening.
- By restarting Apache while looking in the QGIS Server log you can find some extra pointers on how things work.
12.2.2. GetMap requests
In order to display the countries layer, QGIS Desktop, like any other WMS client, is using GetMap requests.
Une simple requête ressemble à:
http://qgisplatform.demo/cgi-bin/qgis_mapserv.fcgi
?MAP=/home/qgis/projects/world.qgs
&SERVICE=WMS
&VERSION=1.3.0
&REQUEST=GetMap
&BBOX=-432786,4372992,3358959,7513746
&SRS=EPSG:3857
&WIDTH=665
&HEIGHT=551
&LAYERS=countries
&FORMAT=image/jpeg
Avec la requête précédente, vous obtiendrez le résultat suivant :
Figure: simple GetMap request to QGIS Server
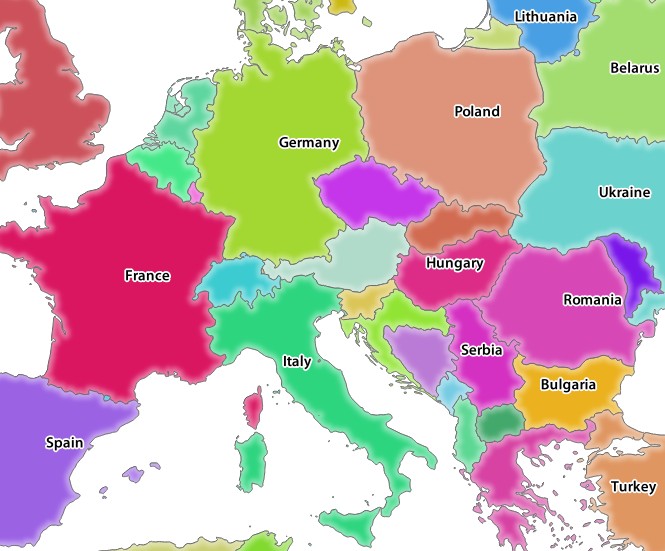
Qgis Server response after a simple GetMap request
12.2.3.  Try Yourself Change the Image and Layers parameters
Based on the request above, let’s replace the countries layer with another.
In order to see what other layers are available you could open up the world.qgs project in QGIS and look at its contents. Keep in mind though that the WMS clients don’t have access to the QGIS project, they just look at the capabilities document contents.
Also, there’s a configuration option so that some of the layers existing in the QGIS project are ignored by QGIS when serving the WMS service.
So, you could look at the layer list when you point QGIS Desktop to the GetCapabilities URL or you could try yourself finding other layer names in the GetCapabilities XML response.
One of the layer names that you could find and works is countries_shapeburst. You may find others but keep in mind some may not be visible at such a small scale so you could get a blank image as response.
You can also play around with others parameters from above, like changing the returned image type to image/png.
12.2.4.  Follow Along: Use Filter, Opacities and Filter parameters
Let’s do another request that adds another layer, some of the Extra parameters supported by all request types, FILTER and OPACITIES, but also uses the standard STYLES parameter.
http://qgisplatform.demo/cgi-bin/qgis_mapserv.fcgi
?MAP=/home/qgis/projects/world.qgs
&SERVICE=WMS
&VERSION=1.3.0
&REQUEST=GetMap
&BBOX=-432786,4372992,3358959,7513746
&SRS=EPSG:3857
&WIDTH=665
&HEIGHT=551
&FORMAT=image/jpeg
&LAYERS=countries,countries_shapeburst
&STYLES=classified_by_name,default
&OPACITIES=255,30
&FILTER=countries:"name" IN ( 'Germany' , 'Italy' )
Avec la requête précédente, vous obtiendrez le résultat suivant :
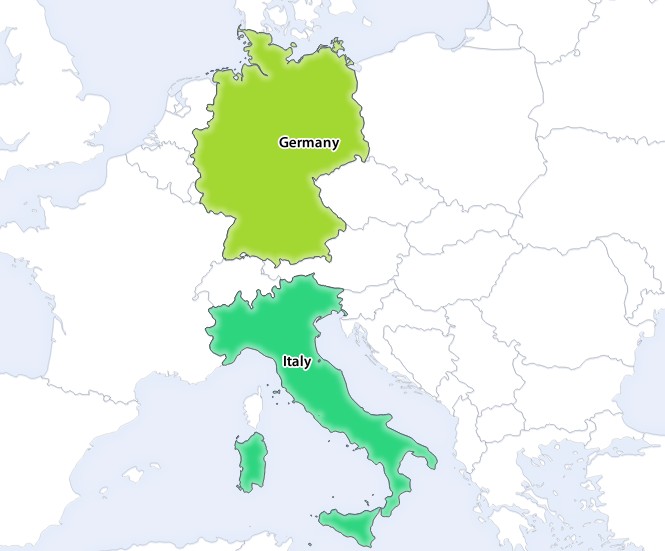
Response to a GetMap request with FILTER and OPACITIES parameters
As you can see from the above image, among other things, we told QGIS Server to render only Germany and Italy from the countries layer.
12.2.5.  Follow Along: Use Redlining
Let’s do another GetMap request that makes use of the REDLINING feature and of the SELECTION parameter detailed in the Extra parameters supported by all request types section:
http://qgisplatform.demo/cgi-bin/qgis_mapserv.fcgi
?MAP=/home/qgis/projects/world.qgs
&SERVICE=WMS
&VERSION=1.3.0
&REQUEST=GetMap
&BBOX=-432786,4372992,3358959,7513746
&SRS=EPSG:3857
&WIDTH=665
&HEIGHT=551
&LAYERS=countries,countries_shapeburst
&FORMAT=image/jpeg
&HIGHLIGHT_GEOM=POLYGON((590000 6900000, 590000 7363000, 2500000 7363000, 2500000 6900000, 590000 6900000))
&HIGHLIGHT_SYMBOL=<StyledLayerDescriptor><UserStyle><Name>Highlight</Name><FeatureTypeStyle><Rule><Name>Symbol</Name><LineSymbolizer><Stroke><SvgParameter name="stroke">%233a093a</SvgParameter><SvgParameter name="stroke-opacity">1</SvgParameter><SvgParameter name="stroke-width">1.6</SvgParameter></Stroke></LineSymbolizer></Rule></FeatureTypeStyle></UserStyle></StyledLayerDescriptor>
&HIGHLIGHT_LABELSTRING=QGIS Tutorial
&HIGHLIGHT_LABELSIZE=30
&HIGHLIGHT_LABELCOLOR=%23000000
&HIGHLIGHT_LABELBUFFERCOLOR=%23FFFFFF
&HIGHLIGHT_LABELBUFFERSIZE=3
&SELECTION=countries:171,65
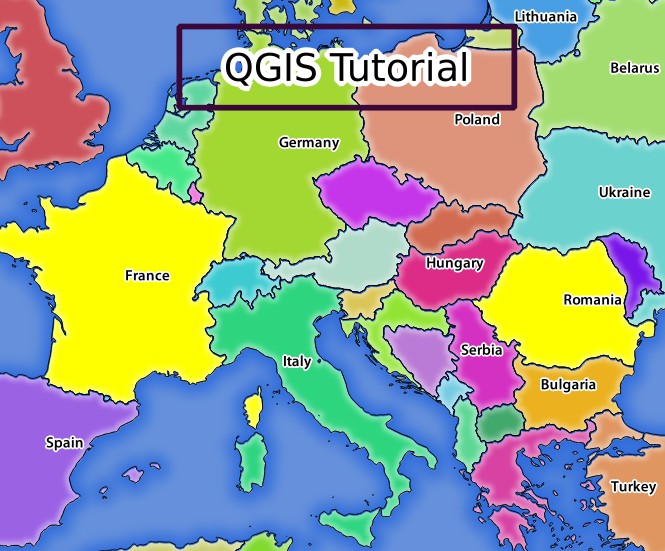
Pasting the above request in your web browser should output the following image:
Response to a request with the REDLINING feature and SELECTION parameter
You can see from the above image that the countries with the 171 and 65 ids were highlighted in yellow (Romania and France) by using the SELECTION parameter and we used the REDLINING feature to overlay a rectangle with the QGIS Tutorial label.
12.2.6. GetPrint requests
One very nice feature of QGIS Server is that it makes use of the QGIS Desktop print composers. You can learn about it in the GetPrint section.
If you open the world.qgs project with QGIS Desktop you will find a print composer named Population distribution. A simplified GetPrint request that exemplifies this amazing feature is:
http://qgisplatform.demo/cgi-bin/qgis_mapserv.fcgi
?map=/home/qgis/projects/world.qgs
&SERVICE=WMS
&VERSION=1.3.0&
REQUEST=GetPrint
&FORMAT=pdf
&TRANSPARENT=true
&SRS=EPSG:3857
&DPI=300
&TEMPLATE=Population distribution
&map0:extent=-432786,4372992,3358959,7513746
&LAYERS=countries
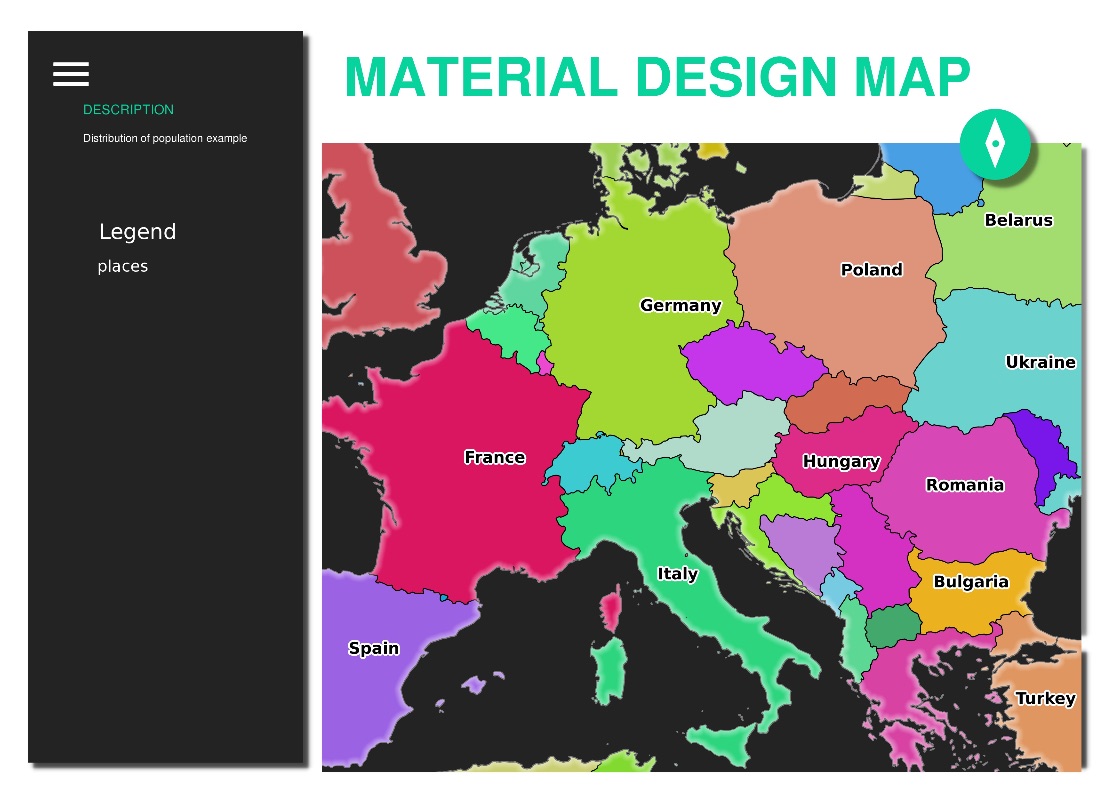
Shows the pdf resulted from the above GetPrint request
Naturally, it’s hard to write your GetMap, GetPrint etc. requests.
QGIS Web Client or QWC is a Web client project that can work alongside QGIS Server so that you can publish your projects on the Web or help you create QGIS Server requests for a better understanding about the possibilities.
You can install it like this:
- As user qgis go to the home directory with cd /home/qgis.
- Download the QWC project from here and unzip it.
- Make a symbolic link to the /var/www/html directory as it’s the DocumentRoot that we’ve setup in the virtual host configuration. If you unzipped the archive under /home/qgis/Downloads/QGIS-Web-Client-master we can do that with sudo ln -s /home/qgis/Downloads/QGIS-Web-Client-master /var/www/html/.
- Access http://qgisplatform.demo/QGIS-Web-Client-master/site/qgiswebclient.html?map=/home/qgis/projects/world.qgs from your Web browser.
Now you should be able to see the Map as in the following figure:
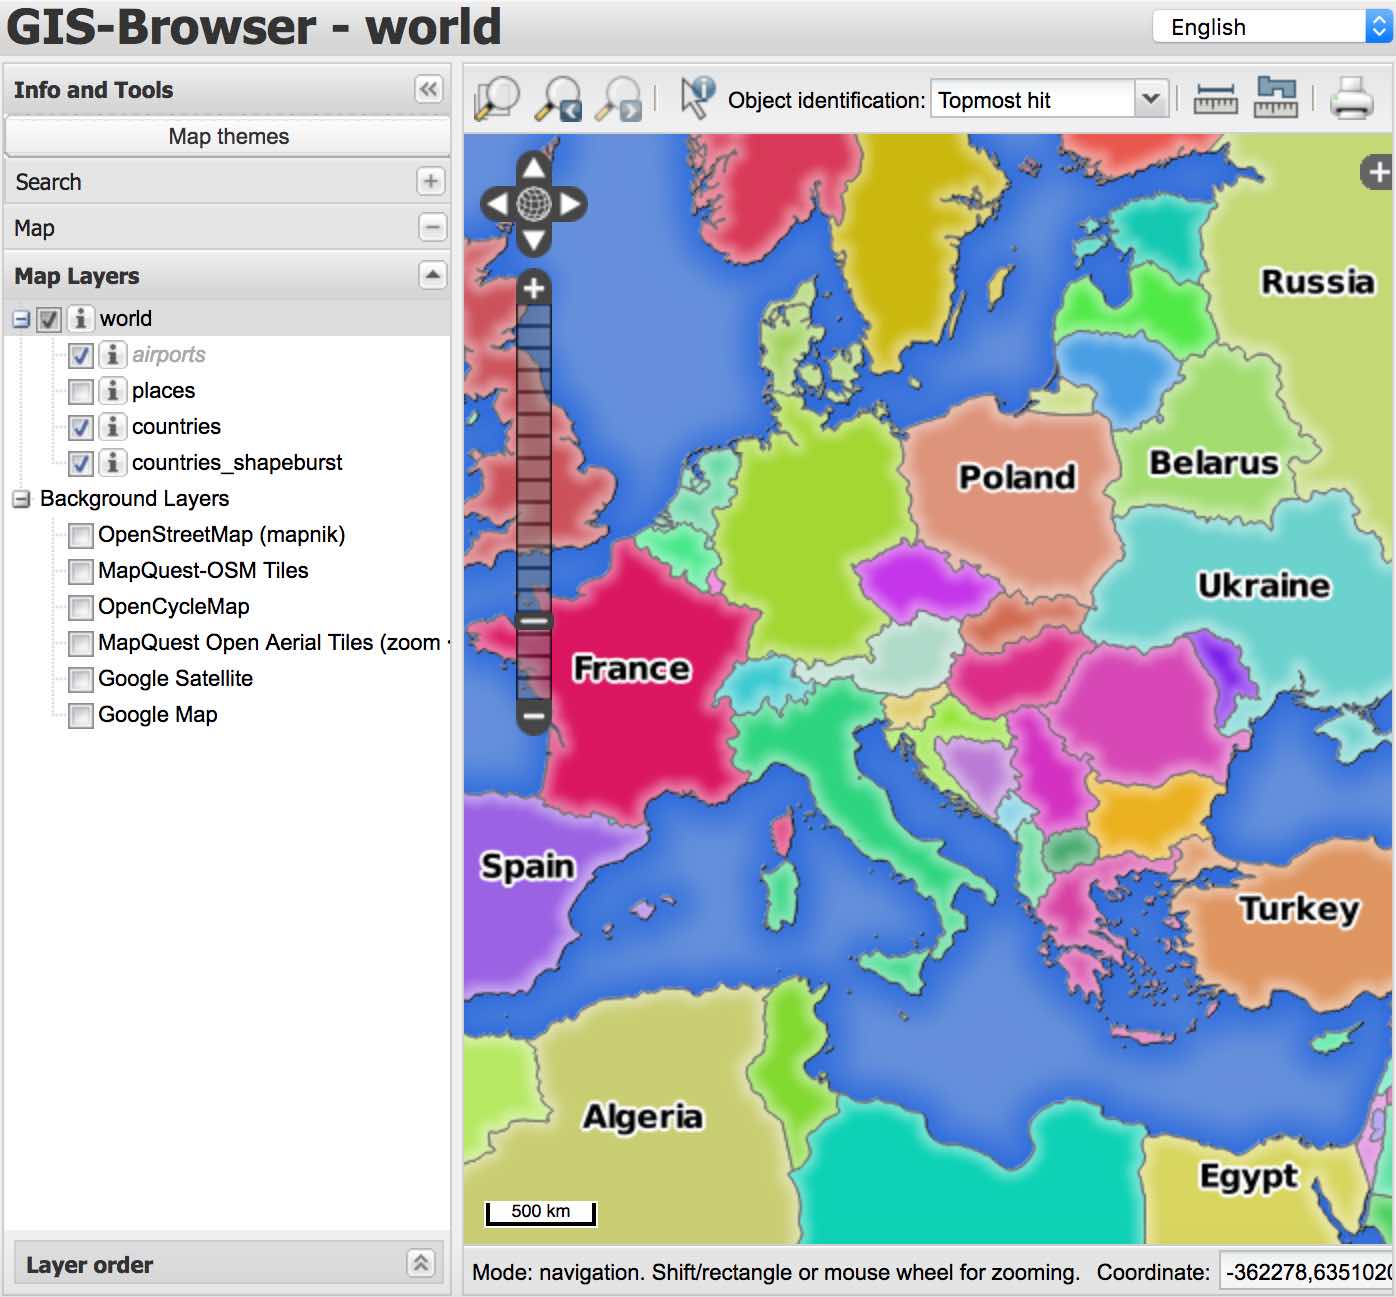
QGIS Web Client consuming the world.qgs project
If you click the Print button in QWC you can interactively create GetPrint requests. You can also click the ? icon in the QWC to access the available help so that you can better discover the QWC possibilities.
12.2.7. In Conclusion
You learned how use QGIS Server to provide WMS Services.
12.2.8. What’s Next?
Next, you’ll see how to use QGIS as a frontend for the famous GRASS GIS.