3.1. Lesson: Travailler avec des données vectorielles
Vector data is arguably the most common kind of data you will find in the daily use of GIS. It describes geographic data in terms of points, that may be connected into lines and polygons. Every object in a vector dataset is called a feature, and is associated with data that describes that feature.
L’objectif de cette leçon : Apprendre à reconnaître la structure des données vectorielles, et la façon de charger des jeux de données vectorielles sur une carte.
3.1.1.  Follow Along: Visualisation des attributs d’une couche
Il est important de comprendre que les données avec lesquelles vous êtes en train de travailler ne montrent pas seulement où ces objets se trouvent dans l’espace, mais aussi vous informent sur ce que sont ces objets.
From the previous exercise, you should have the roads layer loaded in your map. What you can see right now is merely the position of the roads.
To see all the data available to you, with the roads layer selected in the Layers panel:
It will show you a table with more data about the roads layer. This extra data is called attribute data. The lines that you can see on your map represent where the roads go; this is the spatial data.
Ces définitions sont communément utilisées dans les SIG, c’est pourquoi il est essentiel de s’en souvenir !
Vous pouvez maintenant fermer la table d’attributs.
Vector data represents features in terms of points, lines and polygons on a coordinate plane. It is usually used to store discrete features, like roads and city blocks.
3.1.2.  Follow Along: Loading Vector Data From Shapefiles
The Shapefile is a specific file format that allows you to store GIS data in an associated group of files. Each layer consists of several files with the same name, but different file types. Shapefiles are easy to send back and forth, and most GIS software can read them.
Refer back to the introductory exercise in the previous section for instructions on how to add vector layers.
Load the data sets from the epsg4326 folder into your map following the same method:
- “places”
- “water”
- “rivers”
- “buildings”
3.1.3.  Follow Along: Loading Vector Data From a Database
Databases allow you to store a large volume of associated data in one file. You may already be familiar with a database management system (DBMS) such as Microsoft Access. GIS applications can also make use of databases. GIS-specific DBMSes (such as PostGIS) have extra functions, because they need to handle spatial data.
(If you’re sure you can’t see it at all, check that the Manage Layers toolbar is enabled.)
It will give you a new dialog. In this dialog:
- Click the New button.
- In the same epsg4326 folder, you should find the file landuse.sqlite. Select it and click Open.
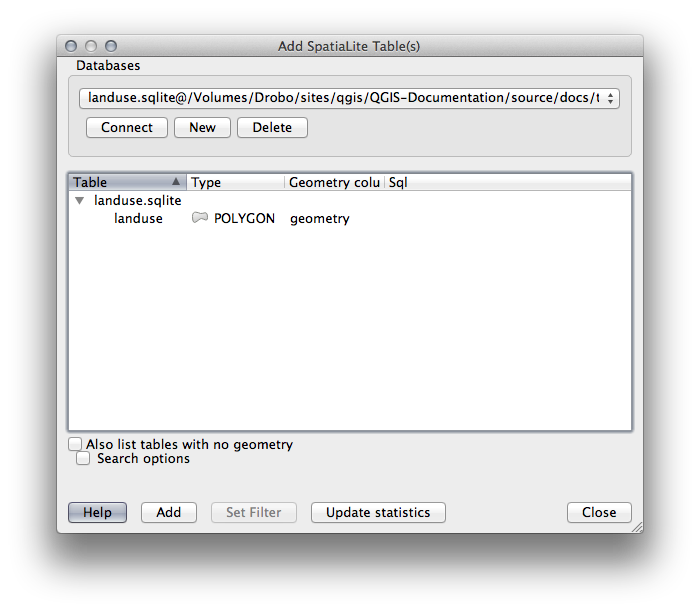
You will now see the first dialog again. Notice that the dropdown select above the three buttons now reads “landuse.sqlite@...”, followed by the path of the database file on your computer.
- Click the Connect button. You should see this in the previously empty box:

- Click on the landuse layer to select it, then click Add
Note
Remember to save the map often! The map file doesn’t contain any of the data directly, but it remembers which layers you loaded into your map.
3.1.4. Follow Along: Réorganisation des calques
Les calques dans votre liste de calques sont dessinés sur la carte dans un certain ordre. Le calque en bas de la liste est dessiné en premier, et le calque en haut est dessiné en dernier. En changeant leur ordre dans la liste, vous pouvez changer l’ordre suivant lesquel ils sont dessinés.
Note
Depending on the version of QGIS that you are using, you may have a checkbox beneath your Layers list reading Control rendering order. This must be checked (switched on) so that moving the layers up and down in the Layers list will bring them to the front or send them to the back in the map. If your version of QGIS doesn’t have this option, then it is switched on by default and you don’t need to worry about it.
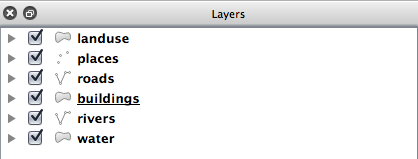
L’ordre dans lequel les couches ont été chargées dans la carte n’est probablement pas logique à ce stade. Il est possible que la couche des routes soit complètement cachée parce que les autres couches sont au-dessus d’elle.
Par exemple, cet ordre de couche…

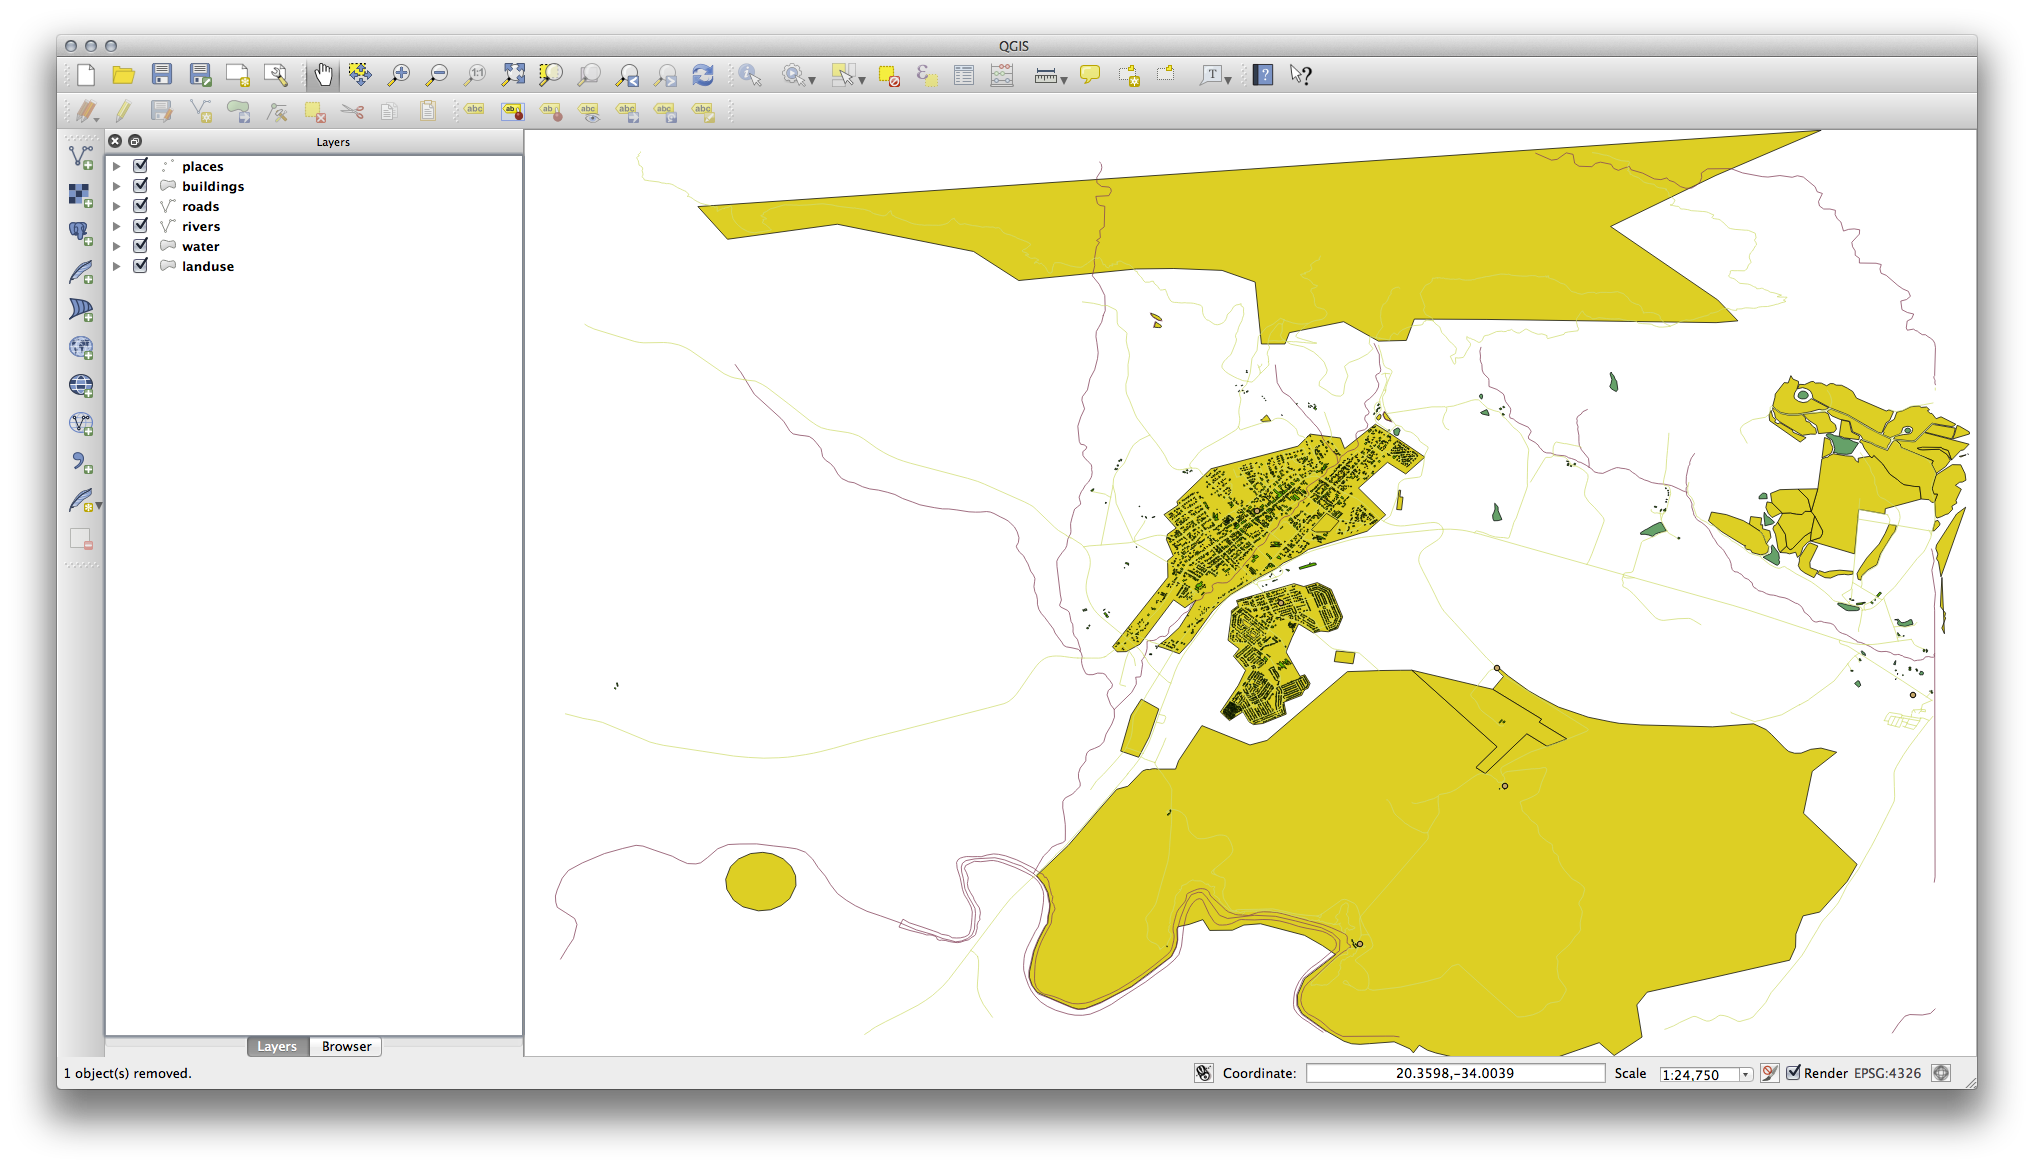
... résultera par une absence de visibilité pour les lieux et les routes car elles sont en dessous des aires urbaines.
Pour résoudre le problème :
Cliquez et glissez sur la couche dans la légende de la carte.
Réorganiser-les pour obtenir ça :

Vous verrez que la carte a maintenant visuellement plus de sens, avec les routes et les bâtiments qui apparaissent au-dessus des régions d’utilisation du sol.
3.1.5. In Conclusion
Maintenant vous avez ajouté tous les calques dont vous aviez besoin à partir de plusieurs différentes sources.
3.1.6. What’s Next?
En utilisant la palette de couleur aléatoire automatiquement assignée lors du chargement des couches, votre carte actuelle n’est sans doute pas facile à lire. Il est donc préférable d’assigner votre propre choix de couleurs et de symboles aux couches. C’est ce que nous verrons dans la prochaine leçon.

