3.1. Lesson: Working with Vector Data
Vector data is arguably the most common kind of data you will find in the daily use of GIS. It describes geographic data in terms of points, that may be connected into lines and polygons. Every object in a vector dataset is called a feature, and is associated with data that describes that feature.
The goal for this lesson: To learn about the structure of vector data, and how to load vector datasets into a map.
3.1.1.  Follow Along: Viewing Layer Attributes
It’s important to know that the data you will be working with does not only represent where objects are in space, but also tells you what those objects are.
From the previous exercise, you should have the roads layer loaded in your map. What you can see right now is merely the position of the roads.
To see all the data available to you, with the roads layer selected in the Layers panel:
- Click on this button:

It will show you a table with more data about the roads layer. This extra data is called attribute data. The lines that you can see on your map represent where the roads go; this is the spatial data.
These definitions are commonly used in GIS, so it’s essential to remember them!
- You may now close the attribute table.
Vector data represents features in terms of points, lines and polygons on a coordinate plane. It is usually used to store discrete features, like roads and city blocks.
3.1.2. Follow Along: Loading Vector Data From Shapefiles
The Shapefile is a specific file format that allows you to store GIS data in an associated group of files. Each layer consists of several files with the same name, but different file types. Shapefiles are easy to send back and forth, and most GIS software can read them.
Refer back to the introductory exercise in the previous section for instructions on how to add vector layers.
Load the data sets from the epsg4326 folder into your map following the same method:
- “places”
- “water”
- “rivers”
- “buildings”
3.1.3. Follow Along: Loading Vector Data From a Database
Databases allow you to store a large volume of associated data in one file. You may already be familiar with a database management system (DBMS) such as Microsoft Access. GIS applications can also make use of databases. GIS-specific DBMSes (such as PostGIS) have extra functions, because they need to handle spatial data.
- Click on this icon:

(If you’re sure you can’t see it at all, check that the Manage Layers toolbar is enabled.)
It will give you a new dialog. In this dialog:
- Click the New button.
- In the same epsg4326 folder, you should find the file landuse.sqlite. Select it and click Open.
You will now see the first dialog again. Notice that the dropdown select above the three buttons now reads “landuse.sqlite@...”, followed by the path of the database file on your computer.
- Click the Connect button. You should see this in the previously empty box:
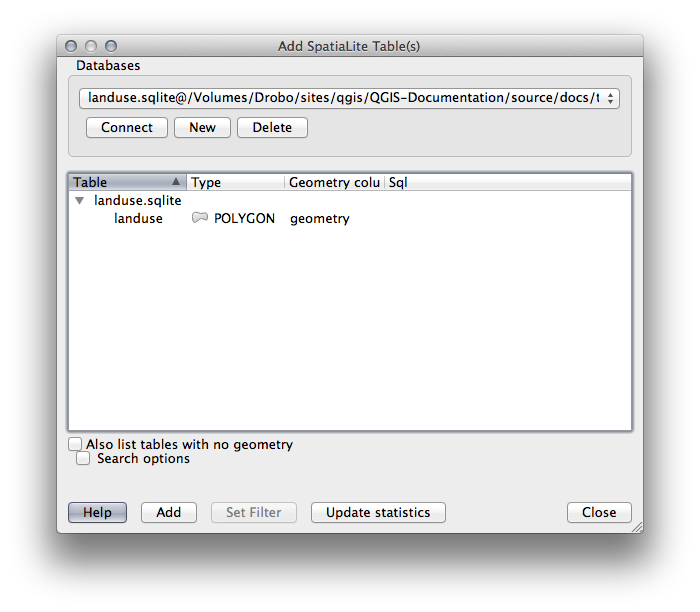
- Click on the landuse layer to select it, then click Add
Muista
Remember to save the map often! The map file doesn’t contain any of the data directly, but it remembers which layers you loaded into your map.
3.1.4. Follow Along: Reordering the Layers
The layers in your Layers list are drawn on the map in a certain order. The layer at the bottom of the list is drawn first, and the layer at the top is drawn last. By changing the order that they are shown on the list, you can change the order they are drawn in.
Muista
Depending on the version of QGIS that you are using, you may have a checkbox beneath your Layers list reading Control rendering order. This must be checked (switched on) so that moving the layers up and down in the Layers list will bring them to the front or send them to the back in the map. If your version of QGIS doesn’t have this option, then it is switched on by default and you don’t need to worry about it.
The order in which the layers have been loaded into the map is probably not logical at this stage. It’s possible that the road layer is completely hidden because other layers are on top of it.
For example, this layer order...
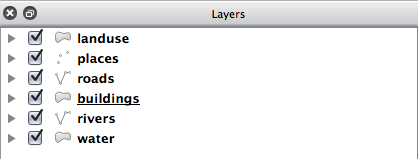
... would result in roads and places being hidden as they run underneath urban areas.
To resolve this problem:
- Click and drag on a layer in the Layers list.
- Reorder them to look like this:
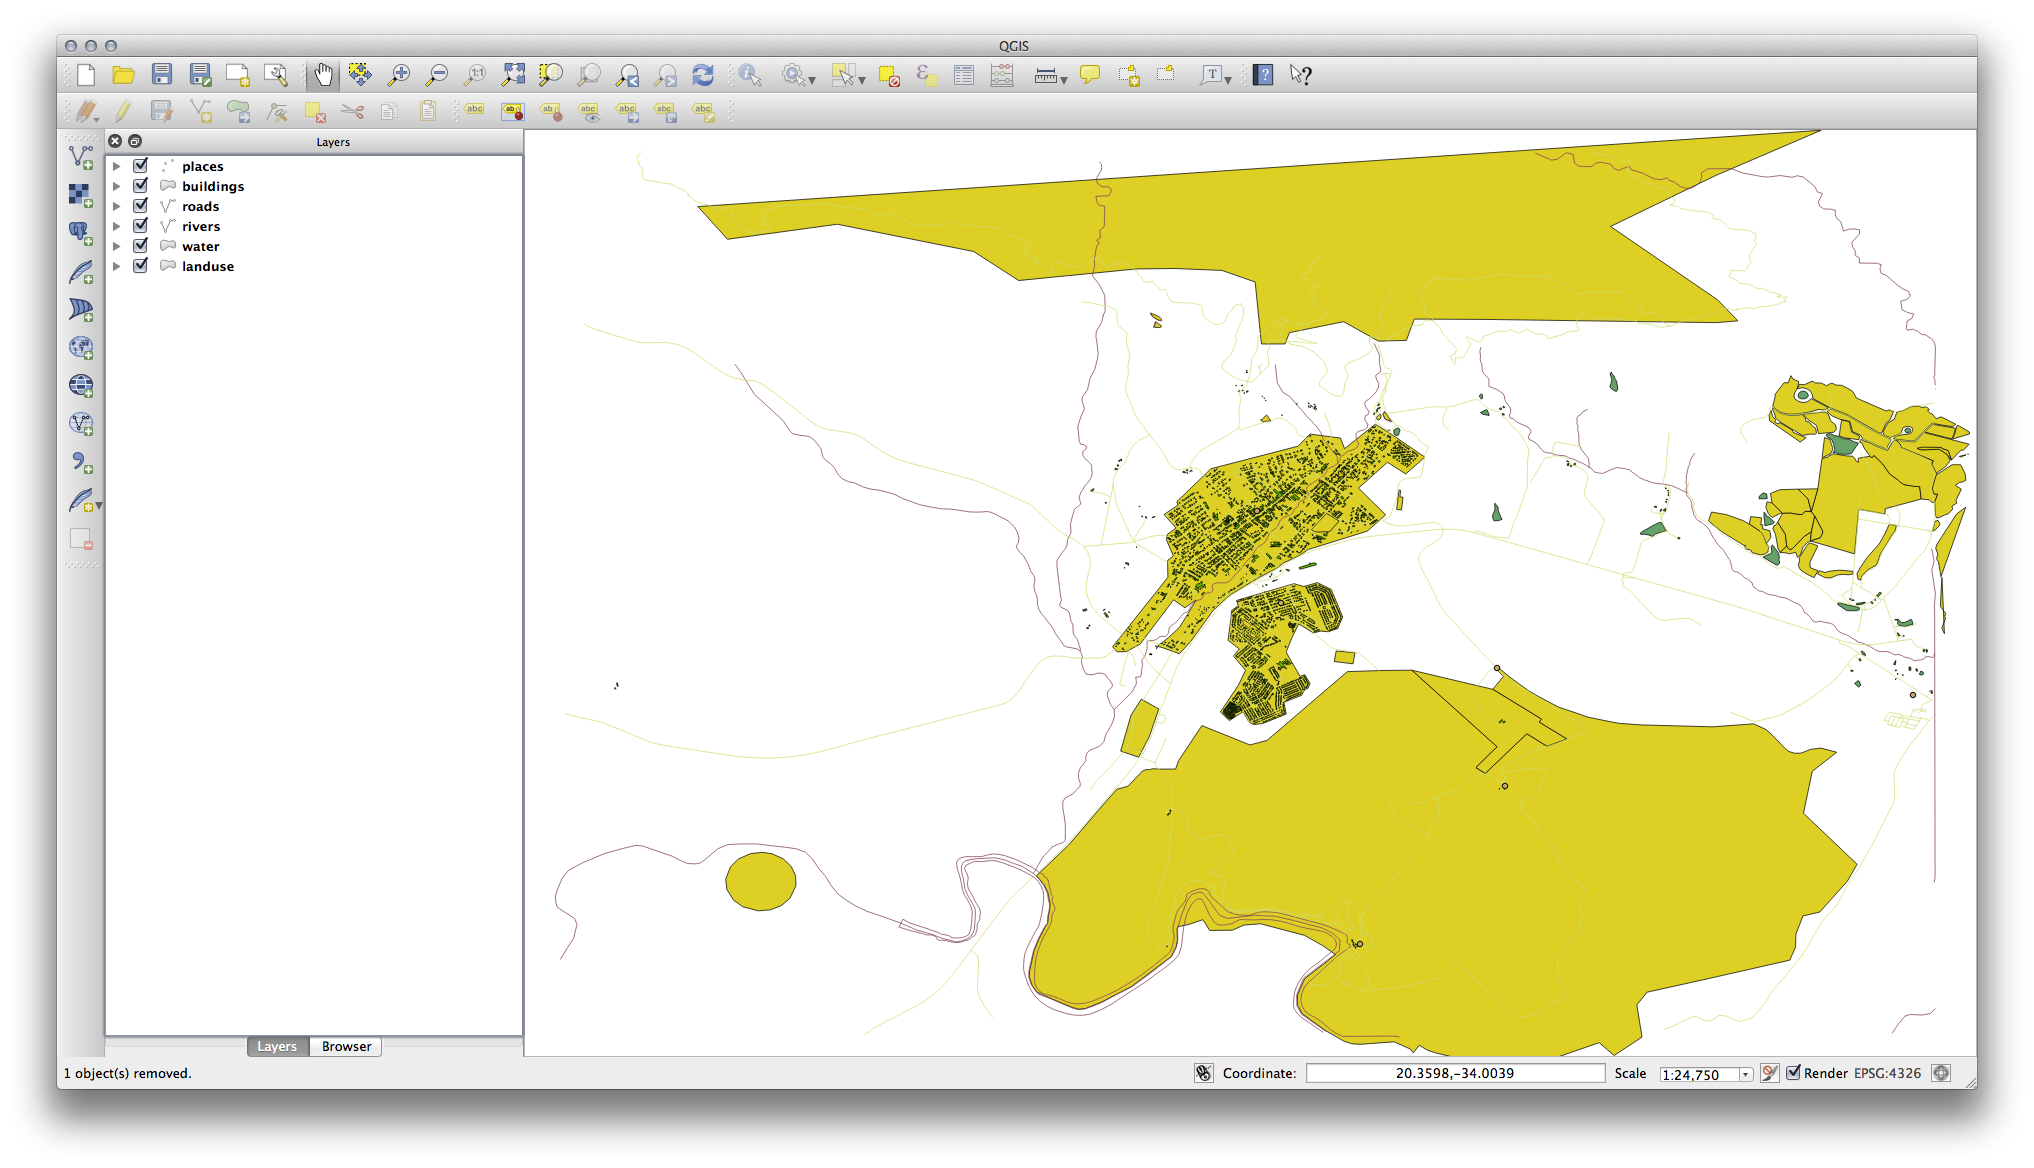
You’ll see that the map now makes more sense visually, with roads and buildings appearing above the land use regions.
3.1.5. In Conclusion
Now you’ve added all the layers you need from several different sources.
3.1.6. What’s Next?
Using the random palette automatically assigned when loading the layers, your current map is probably not easy to read. It would be preferable to assign your own choice of colors and symbols. This is what you’ll learn to do in the next lesson.