3.1. Lesson: Trabajando con datos Vectoriales.
Vector data is arguably the most common kind of data you will find in the daily use of GIS. It describes geographic data in terms of points, that may be connected into lines and polygons. Every object in a vector dataset is called a feature, and is associated with data that describes that feature.
El objetivo de esta lección. Aprender acerca de la estructura de los datos vectoriales, y cómo cargar un conjunto de datos vectoriales dentro de un mapa.
3.1.1.  Follow Along: Viendo los Atributos de la Capa
Es importante saber que los datos con los que estarás trabajando no solo representan dónde están los objetos espacialmente, sino también te dicen qué son esos objetos.
From the previous exercise, you should have the roads layer loaded in your map. What you can see right now is merely the position of the roads.
To see all the data available to you, with the roads layer selected in the Layers panel:
- Click on this button:

It will show you a table with more data about the roads layer. This extra data is called attribute data. The lines that you can see on your map represent where the roads go; this is the spatial data.
Estas definiciones se usan comúnmente en SIG, ¡por eso es esencial recordarlas!
Ahora puedes cerrar la capa de atributos.
Vector data represents features in terms of points, lines and polygons on a coordinate plane. It is usually used to store discrete features, like roads and city blocks.
3.1.2. Follow Along: Loading Vector Data From Shapefiles
The Shapefile is a specific file format that allows you to store GIS data in an associated group of files. Each layer consists of several files with the same name, but different file types. Shapefiles are easy to send back and forth, and most GIS software can read them.
Refer back to the introductory exercise in the previous section for instructions on how to add vector layers.
Load the data sets from the epsg4326 folder into your map following the same method:
- “places”
- “water”
- “rivers”
- “buildings”
3.1.3. Follow Along: Loading Vector Data From a Database
Databases allow you to store a large volume of associated data in one file. You may already be familiar with a database management system (DBMS) such as Microsoft Access. GIS applications can also make use of databases. GIS-specific DBMSes (such as PostGIS) have extra functions, because they need to handle spatial data.
- Click on this icon:

(If you’re sure you can’t see it at all, check that the Manage Layers toolbar is enabled.)
It will give you a new dialog. In this dialog:
- Click the New button.
- In the same epsg4326 folder, you should find the file landuse.sqlite. Select it and click Open.
You will now see the first dialog again. Notice that the dropdown select above the three buttons now reads “landuse.sqlite@...”, followed by the path of the database file on your computer.
- Click the Connect button. You should see this in the previously empty box:
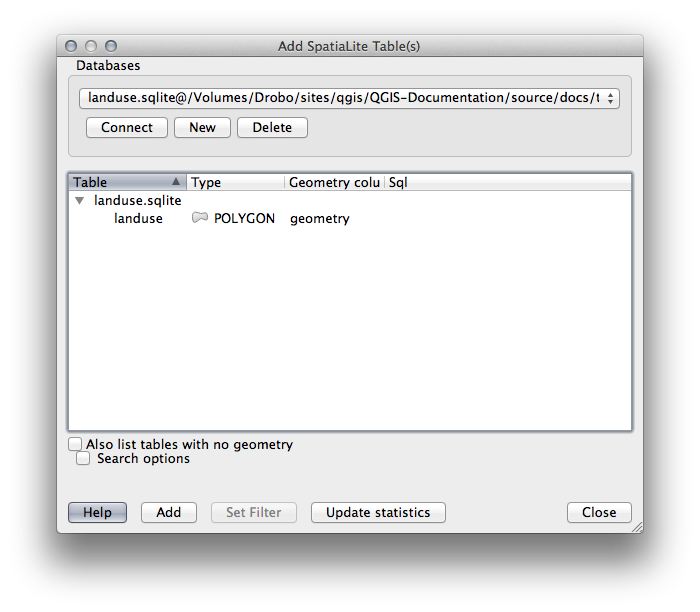
- Click on the landuse layer to select it, then click Add
Nota
Remember to save the map often! The map file doesn’t contain any of the data directly, but it remembers which layers you loaded into your map.
3.1.4. Follow Along: Reordenando las Capas
Las capas en tu lista de Capas están dibujadas en el mapa en cierto orden. La capa de abajo de la lista está dibujada primero, y la capa de la parte superior de la lista es la última dibujada. Cambiando el orden de la lista, puedes cambiar el orden en el que dibujan en el mapa.
Nota
Depending on the version of QGIS that you are using, you may have a checkbox beneath your Layers list reading Control rendering order. This must be checked (switched on) so that moving the layers up and down in the Layers list will bring them to the front or send them to the back in the map. If your version of QGIS doesn’t have this option, then it is switched on by default and you don’t need to worry about it.
El orden en el que las capas se han cargado en el mapa probablemente no sea lógico en este punto. Es posible que la capa calles esté completamente escondida porque otras capas estén por encima de ella.
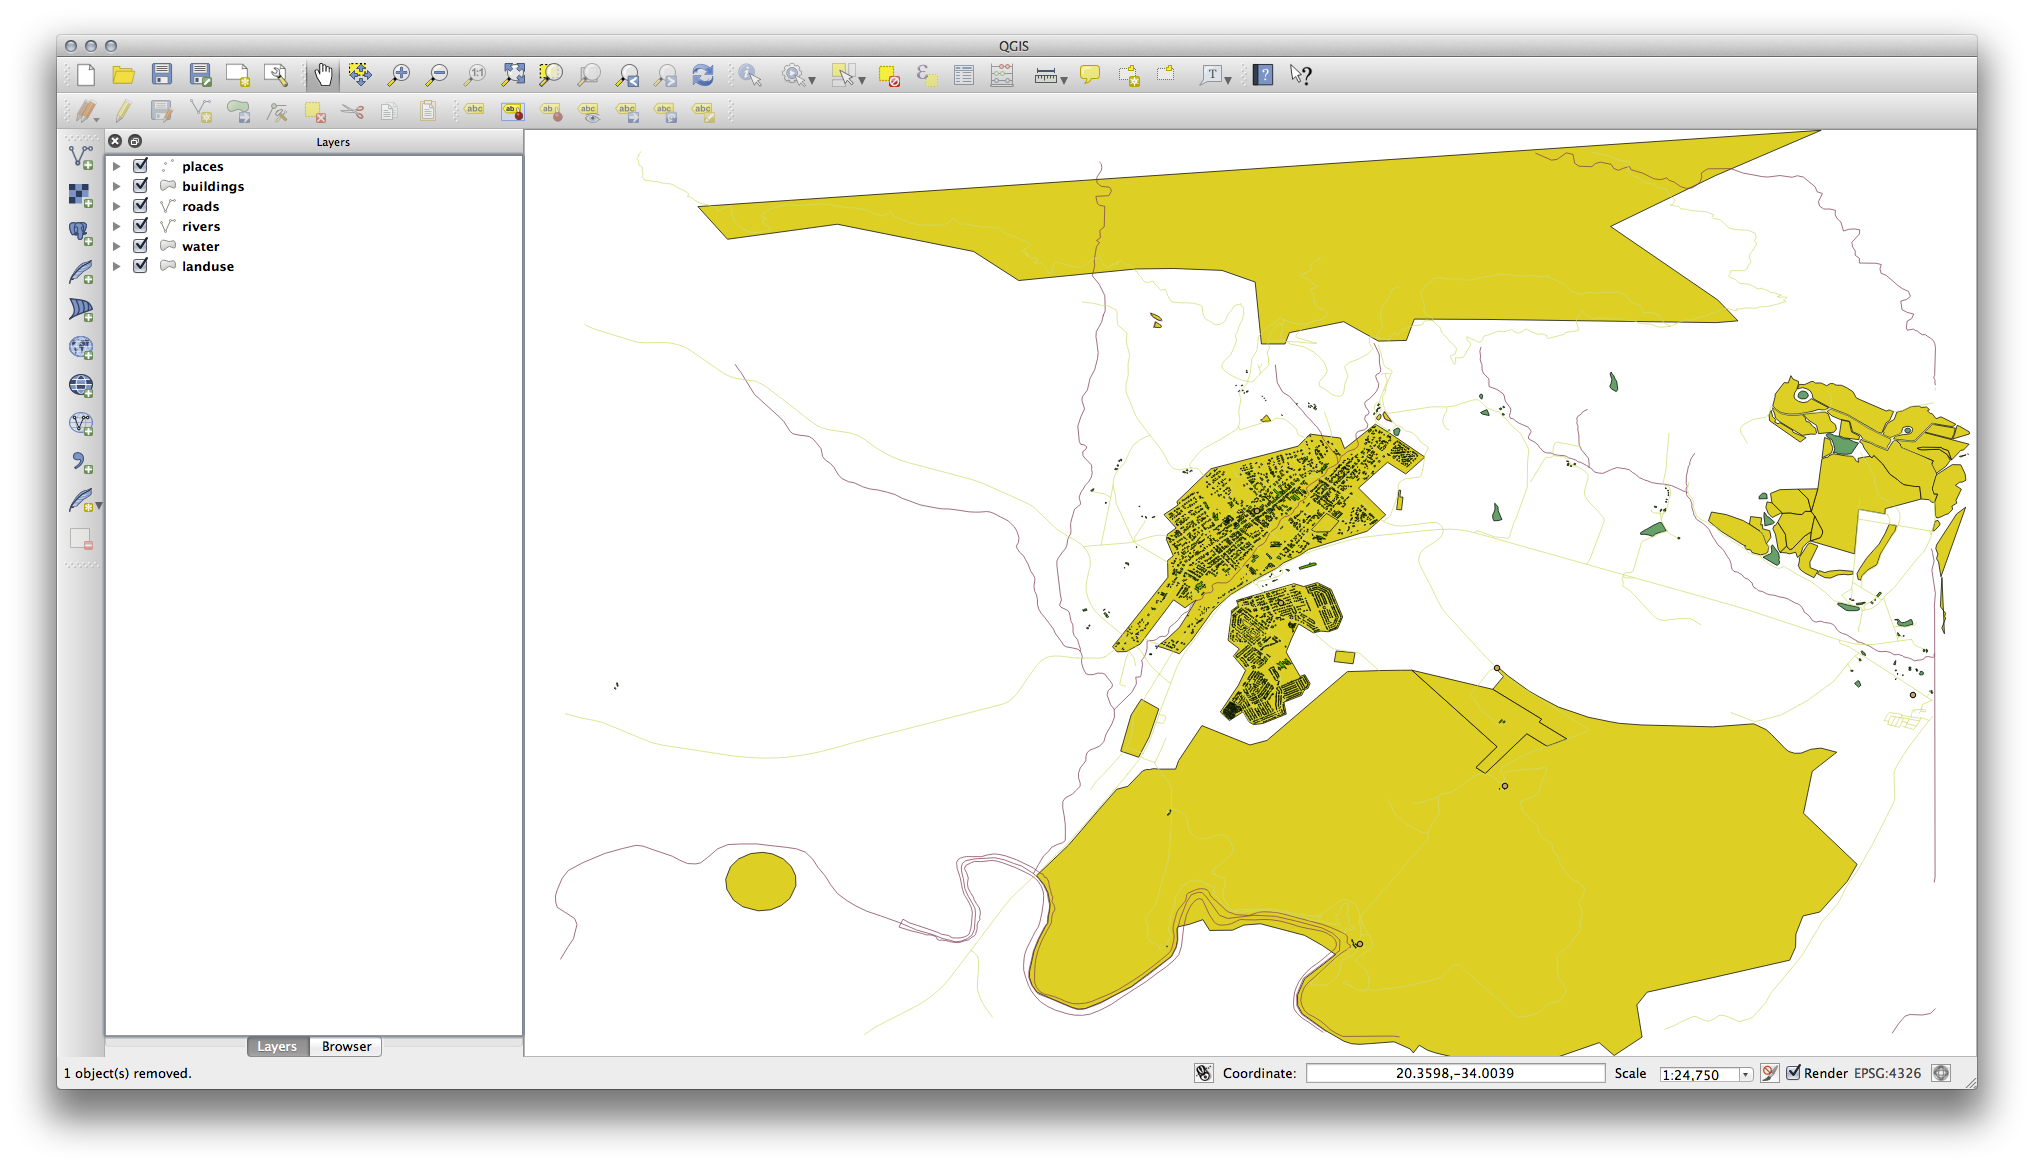
Por ejemplo, este orden de capas...
... podría resultar en calles y sitios escondidos ya que se ejecutan por debajo de áreas urbanas.
Para resolver este problema:
Clica y arrastra sobre una capa en la lista de Capas.
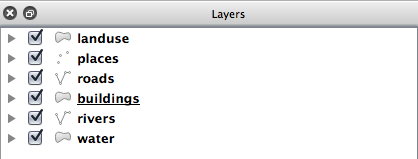
Reordena las capas para que queden así:
Verás que el mapa ahora tiene más sentido visual, con calles y construcciones apareciendo sobre las regiones del territorio.
3.1.5. In Conclusion
Ahora has añadido todas las capas que necesitas desde muchas fuentes diferentes.
3.1.6. What’s Next?
Utilizando la paleta aleatoria asignada automáticamente cuando cargas las capas, tus mapas actuales probablemente no sean fáciles de leer. Sería preferible asignar tu propia elección de colores y símbolos. Esto es lo que aprenderás a hacer en la siguiente lección.