중요
번역은 여러분이 참여할 수 있는 커뮤니티 활동입니다. 이 페이지는 현재 100.00% 번역되었습니다.
20. 예제 데이터 준비하기
중요
강의 담당자나 숙련된 QGIS 사용자가 강의에 로컬 샘플 데이터를 이용하고자 할 경우 이 준비 과정이 필요합니다. 교육 교재와 함께 기본 데이터셋이 제공되지만, 기본 데이터셋을 로컬 데이터로 대체하고자 한다면 다음 지침을 따라야 합니다.
교육 교재와 함께 제공되는 샘플 데이터 는 Swellendam 마을 및 그 주변에 대한 자료입니다. Swellendam 은 남아프리카 공화국의 웨스턴케이프에 있는 케이프타운에서 동쪽으로 2시간 거리에 있습니다. 이 데이터셋의 피처 이름은 영어와 아프리칸스어 두 가지로 되어 있습니다.
누구나 이 데이터셋을 어려움없이 이용할 수 있습니다. 그러나 사용자 자국 또는 고향의 데이터를 이용하고자 할 경우, 3번 강의에서 7번 강의의 2번째 수업까지의 모든 수업에 사용자 데이터를 쓸 수 있습니다. 이후 수업에는 좀더 복잡한 데이터 소스를 사용하게 되는데, 사용자의 지역에 따라 이런 데이터가 존재하지 않을 수도 있습니다.
참고
이 지침은 사용자가 QGIS를 잘 알고 있다고 가정하며, 강의 교재로 쓰이도록 작성된 것은 아닙니다.
20.1. OSM 기반 벡터 파일 생성하기
사용자의 강의에 기본 데이터셋 대신 로컬 데이터를 사용하고자 할 경우 QGIS에 내장된 도구로 간단히 데이터를 준비할 수 있습니다. 이때 사용자가 선택한 지역은 도심과 교외가 균형 있게 분포하며, 서로 다른 종류의 도로와 (자연보호구역 또는 농장 같은) 지역 경계, 그리고 하천 같은 지표수를 포함해야 합니다.
새 QGIS 프로젝트를 여십시오.
메뉴에서 항목을 선택해서 Data Source Manager 대화창을 여십시오.
대화창의 Browser 탭에서 XYZ Tiles 드롭다운 메뉴를 펼친 다음 OpenStreetMap 항목을 더블클릭하십시오.
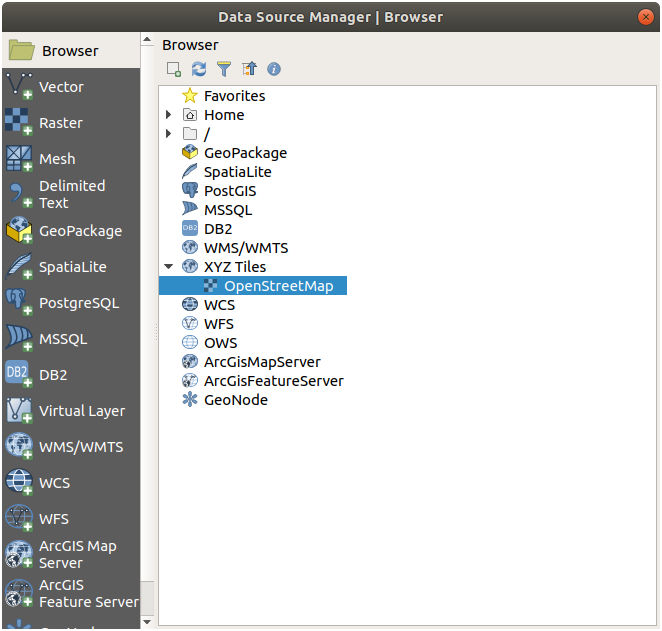
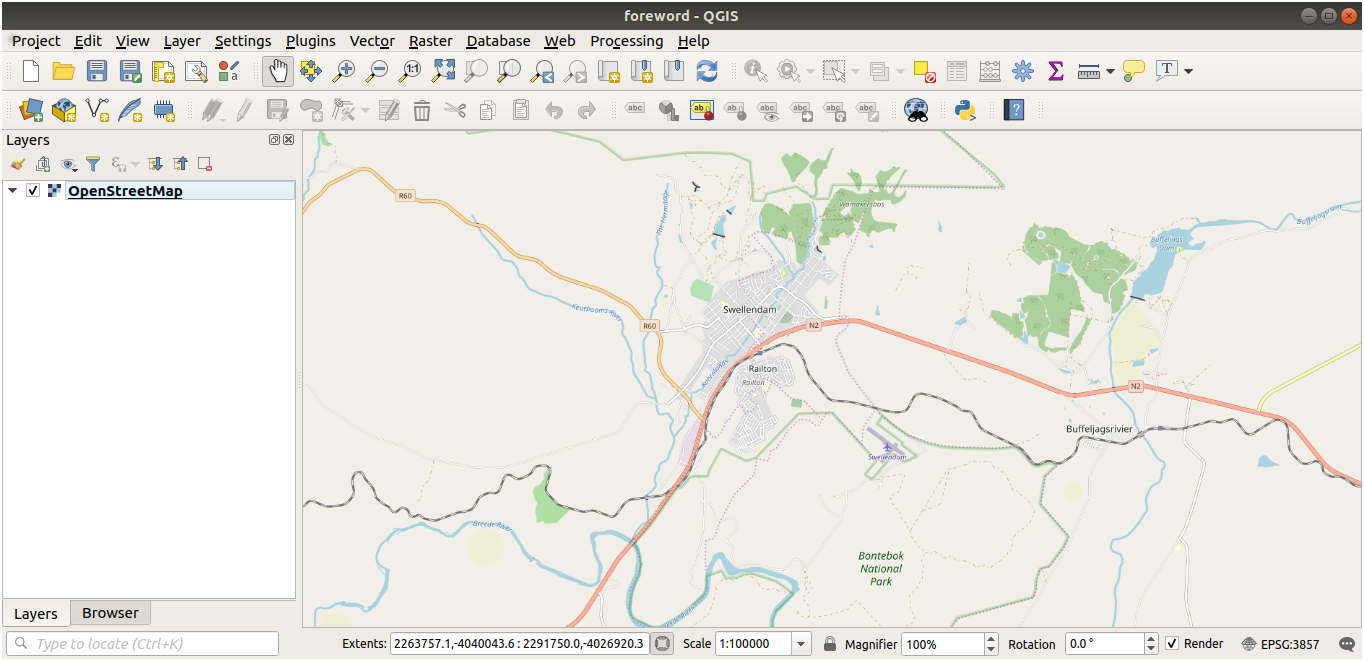
이제 맵 캔버스에 세계 지도가 보일 겁니다.
Data Source Manager 대화창을 닫으십시오.
여러분이 연구 지역으로 사용하고자 하는 지역으로 이동하십시오.
이제 데이터를 추출할 지역을 선택했으니, 추출 도구를 활성화해봅시다.
메뉴에서 항목을 클릭하십시오.
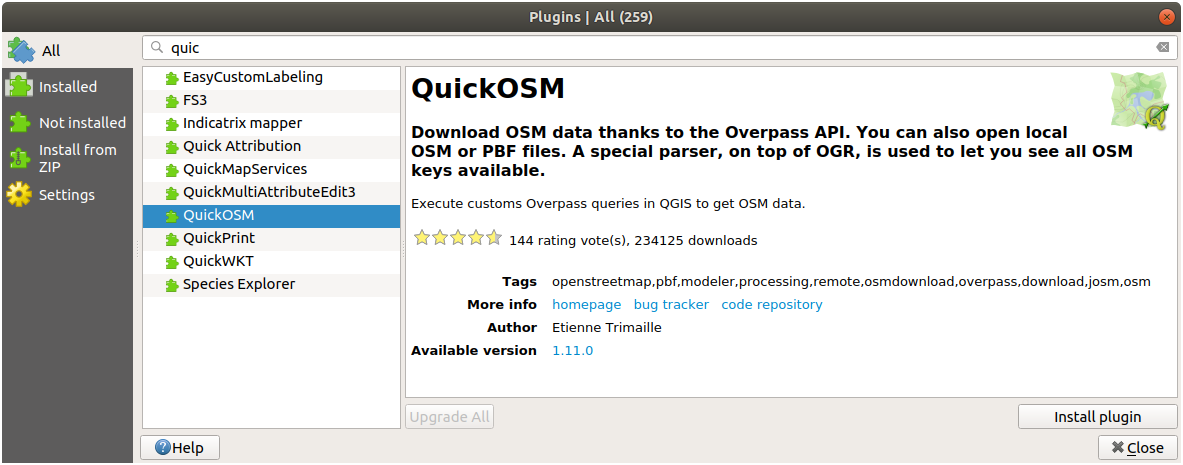
All 탭에 있는 검색란에
QuickOSM이라고 입력하십시오.QuickOSM 플러그인을 선택하고, Install Plugin 버튼을 누른 다음 Close 를 눌러 대화창을 닫으십시오.
메뉴에서 항목을 클릭해서 새 플러그인을 실행하십시오.
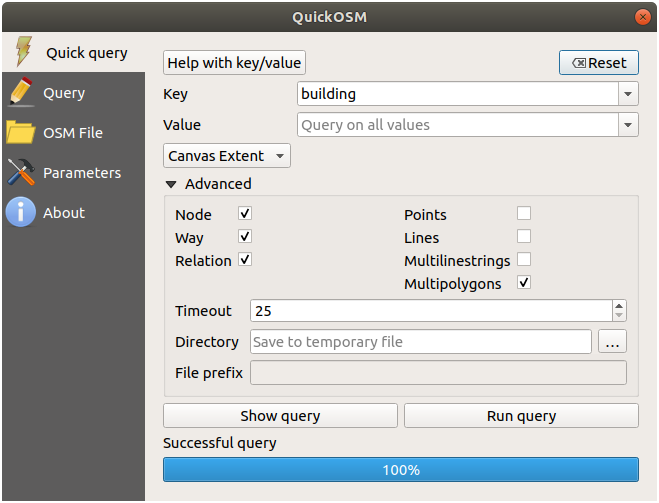
Quick query 탭에 있는 Key 드롭다운 메뉴에서
building을 선택하십시오.Value 필드를 비워두십시오. 모든 건물을 쿼리할 것이라는 의미입니다.
그 다음 드롭다운 메뉴에서 Canvas Extent 를 선택하십시오.
그 아래 있는 Advanced 그룹을 펼친 다음 Multipolygons 를 제외하고, 오른쪽에 있는 도형 유형들을 모두 체크 해제하십시오.
Run query 버튼을 누르십시오.
Layers 패널에 선택한 범위 안에 있는 건물들을 보여주는 새
building레이어가 추가됩니다.앞에서와 같은 방법으로 다른 데이터를 추출하십시오:
Key = landuse그리고 도형 유형은MultipolygonsKey = boundary,Value = protected_area그리고 도형 유형은MultipolygonsKey = natural,Value = water그리고 도형 유형은MultipolygonsKey = highwayand checkLines그리고 도형 유형은MultilinesKey = waterway,Value = river그리고 도형 유형은Lines와MultilinesKey = place그리고 도형 유형은Points
이 과정에서 레이어들은 임시 파일로 추가됩니다. (레이어 이름 옆의  아이콘으로 알 수 있습니다.)
여러분의 지역에서 어떤 유형의 결과물을 얻게 될지 알아보려면 여러분의 지역이 담고 있는 데이터를 샘플링해보면 됩니다.
이제 산출 데이터를 수업에 사용하기 위해 저장해야 합니다. 데이터에 따라 ESRI 셰이프파일(Shapefile), GeoPackage 및 SpatiaLite 포맷을 사용할 것입니다.
place 임시 레이어를 다른 포맷으로 변환하려면:
place레이어 옆에 있는 아이콘을 클릭해서 Save Scratch Layer 대화창을 여십시오.참고
임시 레이어의 속성들 가운데 하나라도 (좌표계, 범위, 필드 등등을) 변경해야 할 경우 컨텍스트 메뉴를 대신 사용하고, Add saved file to map 옵션이 체크되어 있는지 확인하십시오. 새 레이어를 추가하는 옵션입니다.
ESRI Shapefile 포맷을 선택하십시오.
… 버튼을 클릭하고
exercise_data/shapefile/폴더에 파일을places.shp라는 이름으로 저장하십시오.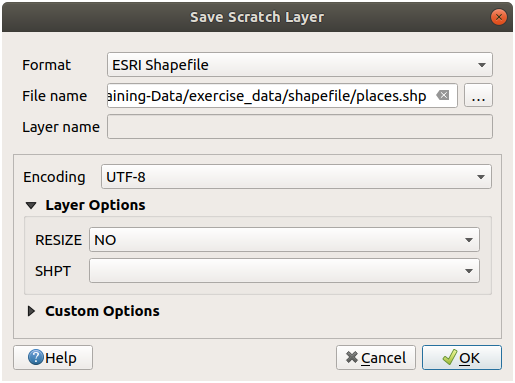
OK 를 클릭하십시오.
Layers 패널에서,
place임시 레이어가 저장한places셰이프파일 레이어로 대체되고 레이어 이름 옆의 임시 아이콘이 사라집니다.이 레이어를 더블클릭해서 레이어의 탭을 열고 Layer name 속성을 파일 이름과 일치하도록 업데이트하십시오.
다른 레이어들에 대해서도 이 과정을 반복하십시오. 다음과 같은 이름으로 변경하면 됩니다:
natural_water를water로waterway_river를rivers로boundary_protected_area를protected_areas로
exercise_data/shapefile/디렉터리에 각각의 산출 데이터를 저장해야 합니다.
다음 단계는 building 레이어로부터 수업에 사용하기 위한 GeoPackage 파일을 생성하는 것입니다:
building레이어 옆에 있는 아이콘을 클릭하십시오.GeoPackage 포맷을 선택하십시오.
exercise_data/폴더에 파일을training_data.gpkg라는 이름으로 저장하십시오.Layer name 은 기본적으로 파일 이름으로 채워집니다.
buildings라는 이름으로 바꾸십시오.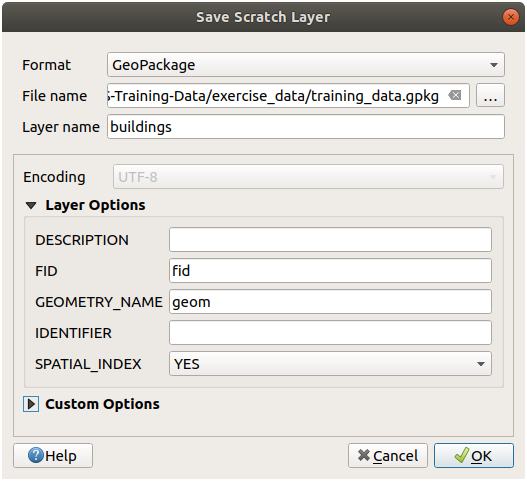
OK 를 클릭하십시오.
레이어 속성 대화창에서 레이어 이름을 변경하십시오.
highway레이어에 대해서도 동일한 과정을 반복하고, 동일한 GeoPackage 데이터베이스에roads라는 이름으로 저장하십시오.
마지막 단계는 나머지 임시 파일을 SpatiaLite 파일로 저장하는 것입니다:
landuse레이어 옆에 있는 아이콘을 클릭하십시오.SpatiaLite 포맷을 선택하십시오.
exercise_data/폴더에 파일을landuse.sqlite라는 이름으로 저장하십시오. Layer name 은 기본적으로 파일 이름으로 채워집니다. 이름을 바꾸지 마십시오.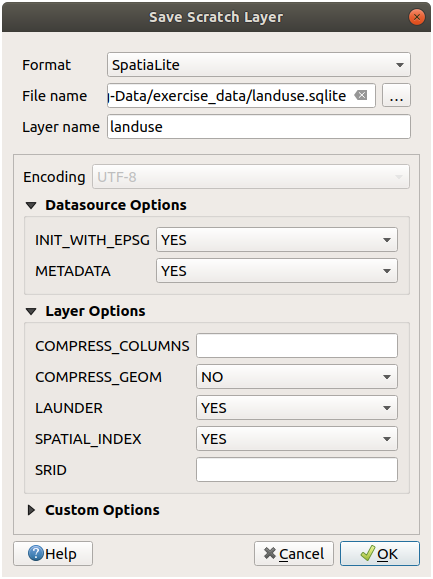
OK 를 클릭하십시오.
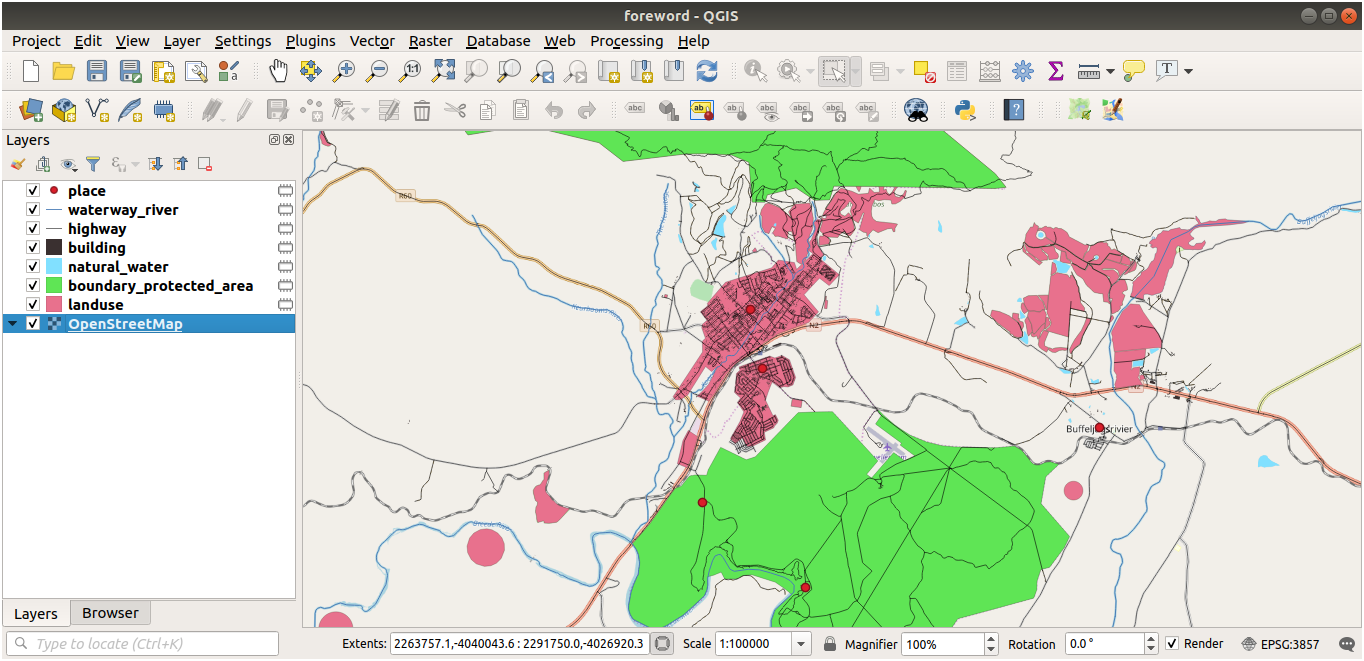
이제 다음처럼 보이는 맵을 보게 될 것입니다(QGIS는 레이어가 맵에 추가될 때 색상을 랜덤하게 할당하기 때문에, 레이어 심볼은 매우 다르게 보일 것입니다):
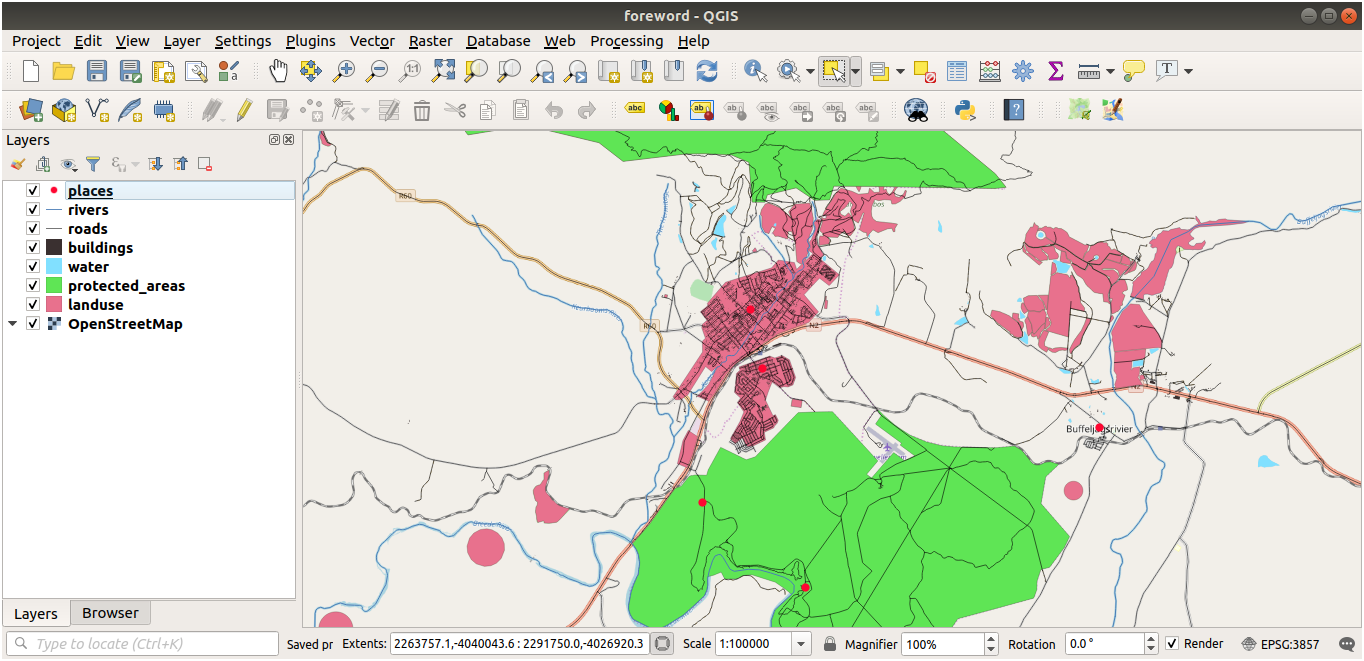
중요한 점은 앞에서 설명했던 것과 일치하는 벡터 레이어 7개를 생성했고, 이 레이어들 모두가 데이터를 가지고 있다는 것입니다.
20.2. SRTM DEM Tiff 파일 생성하기
강의: 벡터 데이터 생성하기 와 강의: 래스터 의 경우, 여러분이 수업을 위해 선택한 지역을 커버하는 래스터 이미지(SRTM DEM)도 필요합니다.
CGIAR-CGI 가 여러분이 https://srtm.csi.cgiar.org/srtmdata/ 로부터 다운로드할 수 있는 몇몇 SRTM DEM을 제공하고 있습니다.
여러분이 사용하기로 선택한 지역 전체를 커버하는 이미지가 필요합니다. 범위 좌표를 찾으려면, QGIS에서 범위가 가장 큰 레이어로  확대/축소한 다음 상태 바의
  Extents 란에 있는 값들을 선택하십시오.
 GeoTiff 포맷은 그대로 유지하십시오. 양식을 채우고나면, Click here to Begin Search >> 버튼을 클릭해서 파일(들)을 다운로드하십시오.
필요한 파일(들)을 다운로드했다면, exercise_data 디렉터리의 raster/SRTM 하위 폴더에 저장해야 합니다.
20.3. 영상 Tiff 파일 생성하기
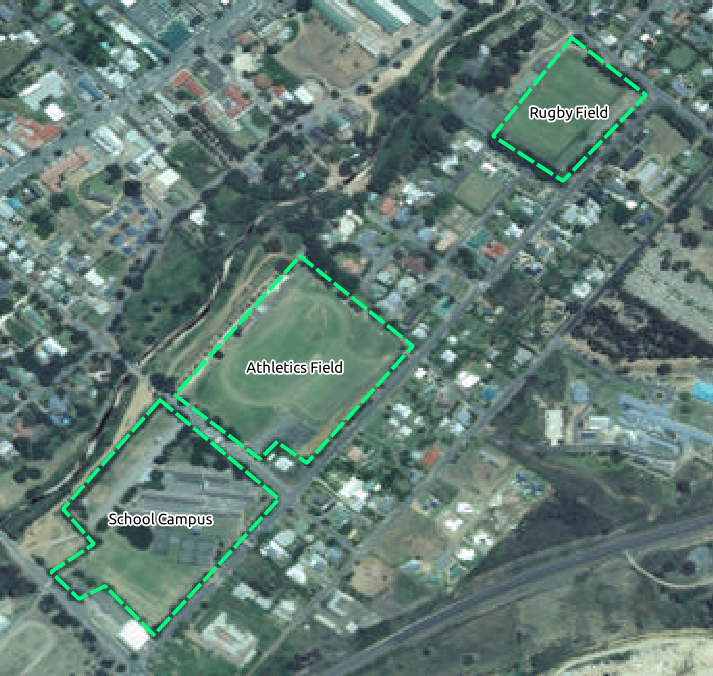
강의: 벡터 데이터 생성하기 의 ★☆☆ 따라해보세요: 데이터 소스 수업에서는 학생들에게 디지타이즈해보라고 하는 학교 운동장 세 곳의 클로즈업(close-up) 이미지를 사용합니다. 따라서 새 SRTM DEM Tiff 파일(들)을 사용해서 이런 이미지를 새로 만들어야 합니다. 반드시 학교 운동장을 사용해야할 필요는 없습니다. 학교의 토지이용 유형들 가운데 아무거나 (예를 들면 학교 건물, 놀이터, 또는 주차장 등등) 3개를 사용하면 됩니다.
예제 데이터의 다음 이미지를 참조하세요:
20.4. 토큰 대체하기
여러분의 로컬 데이터셋을 생성했으니, 마지막 단계는 substitutions.txt 파일에 있는 토큰(token)들을 대체해서 올바른 이름들이 이 교육 교재의 로컬화된 버전에 나타나도록 하는 일입니다.
대체해야 할 토큰들은 다음과 같습니다:
majorUrbanName: 기본값은 “Swellendam”입니다. 여러분의 지역에 있는 주요 도시의 이름으로 대체하십시오.schoolAreaType1: 기본값은 “athletics field”입니다. 여러분의 지역에서 가장 큰 학교 시설 유형의 이름으로 대체하십시오.largeLandUseArea: 기본값은 “Bontebok National Park”입니다. 여러분의 지역에서 가장 큰 토지이용 폴리곤의 이름으로 대체하십시오.srtmFileName: 기본값은srtm_41_19.tif입니다. 여러분의 SRTM DEM 파일 이름으로 대체하십시오.localCRS: 기본값은WGS 84 / UTM 34S입니다. 여러분의 지역에서 사용하는 올바른 좌표계로 대체해야 합니다.