` `
データを開く
オープンソース・ソフトウェアのエコシステムの一環として、QGISは、独自のプロバイダーと組み合わせて、提供機能が読み込まれ、多くの場合、フォーマットの多くを書くための異なるライブラリーに基づいて構築されています。
- Vector data formats include ESRI formats (shapefiles, geodatabases...), MapInfo and MicroStation file formats, AutoCAD DWG/DXF, GeoPackage, GeoJSON, GRASS, GPX, KML, Comma Separated Values, and many more... Read the complete list of OGR vector supported formats;
- Raster data formats include ArcInfo Binary Grid, ArcInfo ASCII Grid, JPEG, GeoTIFF, ERDAS IMAGINE, MBTiles, R or Idrisi rasters, ASCII Gridded XYZ, GDAL Virtual, SRTM, Sentinel Data, and many more... Read the complete list of raster supported formats;
- Database formats include PostgreSQL/PostGIS, SQLite/SpatiaLite, Oracle, DB2 or MSSQL Spatial, MySQL...;
- Support of web data services (WM(T)S, WFS, WCS, CSW, ArcGIS Servers...) is also handled by QGIS providers (see OGCデータクライアントとしてのQGIS);
また、アーカイブフォルダからサポートされたファイルを読み込むと、このような仮想およびメモリレイヤーとしてQGISのネイティブフォーマットを使用できます。
As of the date of this document, more than 80 vector and 140 raster formats are supported by the GDAL/OGR and QGIS native providers.
ノート
リストに含まれるフォーマットは、様々な理由から、すべてはQGISで動作しないかもしれません。例えば、いくつかは、外部の独自のライブラリを必要としたり、ご使用のOSの GDAL/OGR のインストールが使用したい形式をサポートするように構築されていない可能性があります。利用可能なフォーマットのリストを得るには、コマンドライン ogrinfo--formats を実行する(ベクター用)、またはQGISで 設定 ‣ オプション ‣ GDAL メニューを確認します(ラスター用)。
ブラウザパネル
QGIS Browser is one of the main panels of QGIS that lets you quickly and easily add your data to projects. It helps you navigate in your filesystem and manage geodata, regardless the type of layer (raster, vector, table), or the datasource format (plain or compressed files, database, web services).
To add a layer into a project:
- right-click on QGIS toolbar and check
 Browser Panel
to activate it or select it from the menu View ‣ Panels
(or
Browser Panel
to activate it or select it from the menu View ‣ Panels
(or  Settings ‣ Panels);
 - a browser tree with your filesystem, databases and web services is displayed;
- find the layer in the list;
- right-click on its name and select Add selected layer(s). Your layer is now added to the Layers Panel and can be viewed in the map canvas.
ノート
You can also add a layer or open a QGIS project directly from the Browser panel by double-clicking its name or by drag-and-drop into the map canvas.
ファイルがロードされたら、地図のナビゲーションツールを使用して、それを中心にズームできます。レイヤーのスタイルを変更するには、レイヤー名上ダブルクリックするか、または凡例の名前を右クリックしてコンテキストメニューから プロパティ を選択することで、 レイヤープロパティ ダイアログを開きます。ベクターレイヤーのシンボルの設定の詳細は、 Style Properties セクションを参照。
パネルの上部には幾つかのアイコンがあり、あなたの助けになります:
 選択レイヤーを追加 項目:また、レイヤーのコンテキストメニューから 選択したレイヤー(複数可)を追加 を選択することで、地図キャンバスにデータを追加できます。
 ブラウザツリーを 更新 ;
 フィルタブラウザ 特定のデータを検索します。検索ワードまたはワイルドカードを入力して、ブラウザがDBテーブル、ファイル名やフォルダをマッチングするだけショーのパスにツリーをフィルタリングします - 他のデータやフォルダは表示されません。 figure_browser_panels 上のブラウザパネル(2)の例を参照してください。比較では、大文字と小文字は区別であってもなくてもよいです。また、に設定できます。
通常 :検索テキストを含む任意の項目を返します
ワイルドカード(複数可) を使用: ? および/または * 文字を使用して検索を微調整し、検索テキストの位置を指定します
正規表現 を使用して
 ツリー全体を すべてを折りたたむ
 Enable/disable properties widget: when toggled on,
a new widget is added at the bottom of the panel showing, if applicable,
metadatas of the selected item.
Enable/disable properties widget: when toggled on,
a new widget is added at the bottom of the panel showing, if applicable,
metadatas of the selected item.
ブラウザツリー内の項目を右クリックし、次のことに役立ちます。
ファイルまたはテーブルの場合には、そのメタデータを表示したり、プロジェクトで開きます。テーブルは、名前変更、削除または切り捨てもできます;
フォルダの場合は、お気に入りにそれをブックマークし、ブラウザツリーからそれを隠します。隠しフォルダは 設定 ‣ オプション ‣ データソース タブから管理できます:
データベースやWebサーバーへの接続を作成します。
スキーマを更新し、名前の変更または削除。
簡単なドラッグアンドドロップで、データベースにファイルをインポートしたり、あるスキーマ/データベースから別のものにテーブルをコピーしたりもできます。ドラッグ中に長いスクロールをしなくてよいよう、利用可能な2番目のブラウザパネルがあります。ファイルを選択し、あるパネルから他へドラッグアンドドロップするだけです。
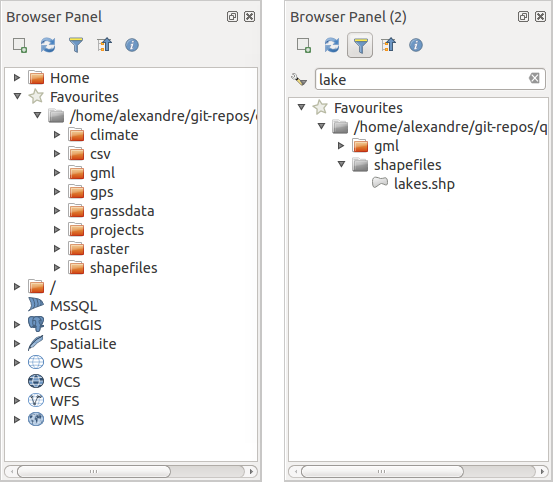
横並びのQGISブラウザパネル
ちなみに
お使いのOSのファイルブラウザからの簡単なドラッグ&ドロップでQGISにレイヤーを追加します
ファイルをプロジェクトに追加するには、オペレーティングシステムのファイルブラウザから レイヤーパネル または地図キャンバスにファイルをドラッグアンドドロップします。
DBマネージャ
DBマネージャ プラグインは、QGIS(PostGIS、SpatiaLite、GeoPackage、Oracle Spatial、MSSQL、DB2、Virtual layers)でサポートされている空間データベースフォーマットを1つのユーザーインターフェイスで統合して管理するための主要なツールです。 プラグイン ‣ プラグインの管理とインストール... メニューから起動できます。
 DBマネージャ プラグインはいくつかの機能を提供します。
データベースに接続し、その構造と内容を表示します。
データベースのプレビューテーブル。
いずれかをダブルクリックするか、ドラッグ・アンド・ドロップで、地図キャンバスにレイヤーを追加します。
QGISのブラウザから、または別のデータベースからデータベースにレイヤーを追加します。
地図キャンバスにSQLクエリの出力を作成し追加します。
virtual layers を作成します。
DBマネージャの機能の詳細については、 DB マネージャプラグイン で公開されています。
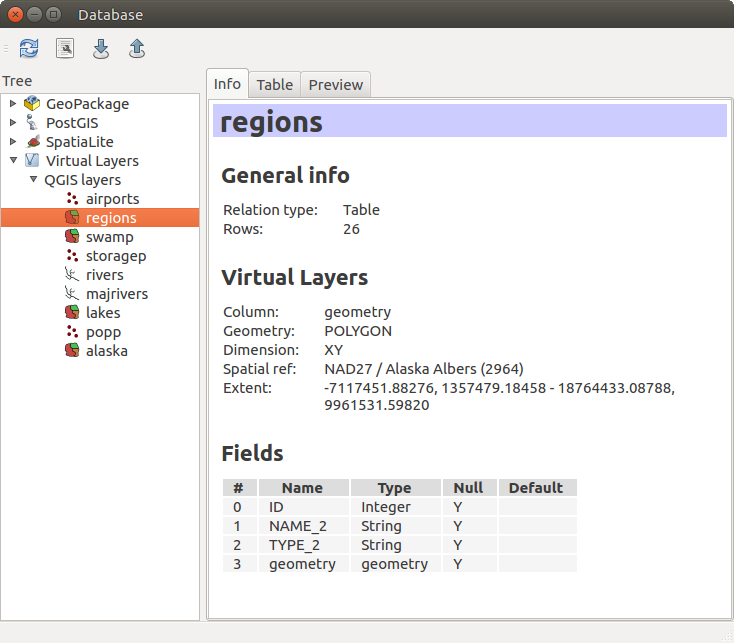
[DBマネージャ]ダイアログ
プロバイダーベースのロードツール
QGISがフォーマットに関係なくレイヤーを追加するために提供する主なツールであるブラウザパネルとDBマネージャのほかに、データプロバイダー固有のツールもあります。
ノート
外部プラグイン にはQGISで特定のフォーマットファイルを開くためのツールも提案するものがあります。
ファイルからレイヤーを読み込む
ファイルからレイヤーを読み込むには:
for vector data (like Shapefile, Mapinfo or dxf layer), click on
 Add Vector Layer toolbar button, select the
Layer ‣ Add Layer ‣ Add Vector
Layer menu option or press Ctrl+Shift+V.
This will bring up a new window (see figure_vector_add) from which you can
check
Add Vector Layer toolbar button, select the
Layer ‣ Add Layer ‣ Add Vector
Layer menu option or press Ctrl+Shift+V.
This will bring up a new window (see figure_vector_add) from which you can
check  File and click on [Browse]. You can
also specify the encoding for the file if desired.
File and click on [Browse]. You can
also specify the encoding for the file if desired.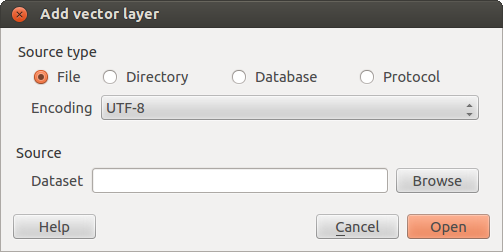
ベクターレイヤーダイアログを追加
ラスターレイヤーの場合は、
 ラスターレイヤーを追加 アイコンをクリックし、 レイヤー ‣ レイヤーを追加 ‣ ラスターレイヤーを追加 メニューオプションを選択するか、または Ctrlキー+Shiftキー+R をキーボード入力します。
これにより、ファイルシステムをナビゲートし、シェープファイル、geotiff、またはその他のサポートされているデータソースを読み込むことができる標準の[ファイルを開く]ダイアログ( figure_vector_open 参照)が表示されます。選択ボックス フィルタ  サポートされているファイル形式をあらかじめ選択できます。十分テストされている形式だけがリストに表示されます。 すべてのファイル(*.*) を選択することで、未テストの他のフォーマットを読み込むことができます。
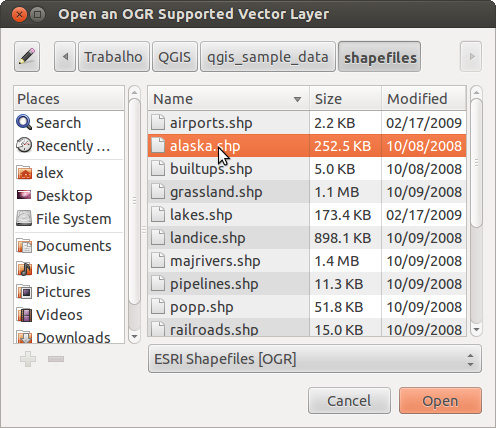
OGRサポートベクタレイヤーダイアログを開きます。
Selecting a file from the list and clicking [Open] loads it into QGIS. More than one layer can be loaded at the same time by holding down the Ctrl or Shift key and clicking on multiple items in the dialog. Figure_vector_loaded shows QGIS after loading the alaska.shp file.
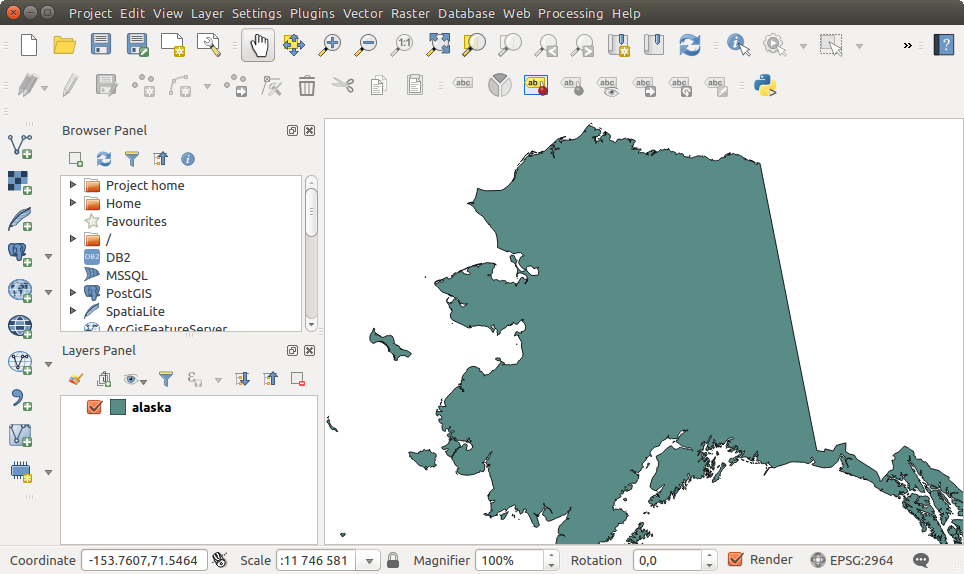
アラスカのシェープファイルがロードされたQGIS
ノート
MapInfo(例えば、 .tab )やAutocad( .dxf )のようないくつかのフォーマットは、1つのファイルに異なるタイプのジオメトリを混在させることができるので、QGISでそのようなフォーマットをロードすると、レイヤーあたり1つのジオメトリとするために使用するダイアログが開きます。
Using the Add Vector Layer tool:
You can also load specific formats like ArcInfo Binary Coverage, UK. National Transfer Format, as well as the raw TIGER format of the US Census Bureau or OpenfileGDB. To do that, you’d need to select
Directory as Source type. In this case
a directory can be selected in the dialog after pressing [Browse].With the
Database source type you can select an
existing database connection or create one to the selected database type.
Available database types are ODBC, OGDI Vectors, Esri Personal
Geodatabase, MySQL as well as PostgreSQL or MSSQL.Pressing the [New] button opens the Create a New OGR Database Connection dialog whose parameters are among the ones you can find in ストアドコネクションを作成する. Pressing [Open] you can select from the available tables for example of the PostGIS enabled database.
The last source type,
Protocol, enables to open
data from the web using for example GeoJSON or CouchDB format. After
selecting the type you have to fill URI of the source.
ちなみに
macOSで外部ドライブからレイヤーとプロジェクトをロードする
On macOS, portable drives that are mounted beside the primary hard drive do not show up as expected under File ‣ Open Project. We are working on a more macOS-native open/save dialog to fix this. As a workaround, you can type /Volumes in the File name box and press Enter. Then you can navigate to external drives and network mounts.
区切りテキストファイルをインポートする
Delimited text file (e.g. .csv, .txt) can be loaded in QGIS
using the tools described above. However, loaded this way, it’ll show up like a
simple table data. Sometimes, delimited text files can contain geometric data
you’d want to visualize; this is what the  Add
Delimited Text Layer is designed for.
Add
Delimited Text Layer is designed for.
Click the toolbar icon Add Delimited Text Layer in the
Manage layers toolbar to open the Create a Layer from a
Delimited Text File dialog, as shown in figure_delimited_text.
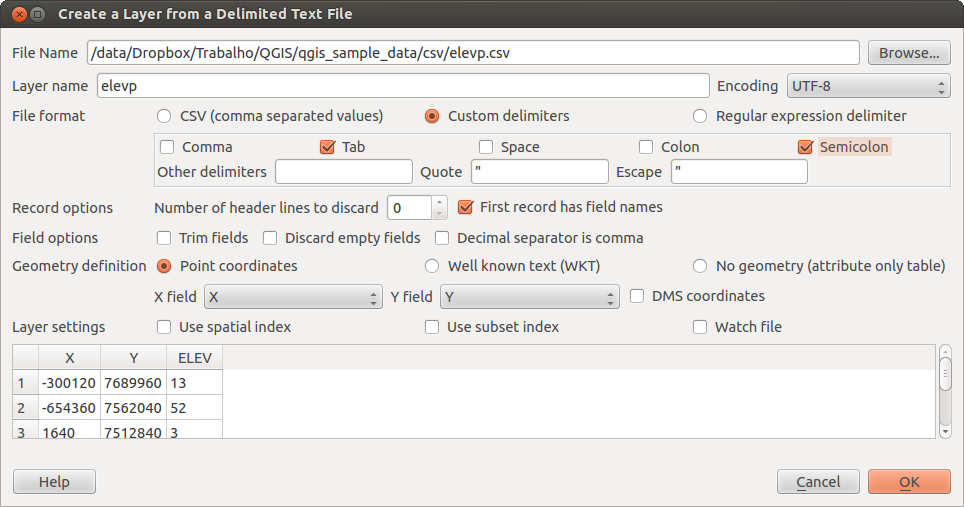
区切りテキストダイアログ
First, select the file to import (e.g., qgis_sample_data/csv/elevp.csv) by clicking on the [Browse] button. Once the file is selected, QGIS attempts to parse the file with the most recently used delimiter. To enable QGIS to properly parse the file, it is important to select the correct delimiter. You can specify a delimiter by activating:
- CSV (comma separated values);
 カスタム区切り文字,、 コンマ 、 スペース 、 タブ 、 セミコロン ... ...のような、あらかじめ定義された区切り文字の中から選択します。
または
正規表現の区切り文字 と 式 フィールドにテキストを入力します。たとえば、区切り文字をタブに変更するには、 \t (これはタブ文字の正規表現です)を使用します。
Once the file is parsed, set Geometry definition to
Point coordinates and choose the X and Y
fields from the dropdown lists. If the coordinates are defined as
degrees/minutes/seconds, activate the DMS coordinates
checkbox.
Finally, enter a layer name (e.g., elevp), as shown in figure_delimited_text. To add the layer to the map, click [OK]. The delimited text file now behaves as any other map layer in QGIS.
There is also a helper option that allows you to trim leading and trailing
spaces from fields — Trim fields. Also, it is possible
to Discard empty fields. If necessary, you can force a
comma to be the decimal separator by activating Decimal
separator is comma.
If spatial information is represented by WKT, activate the
Well Known Text option and select the field with the WKT definition
for point, line or polygon objects. If the file contains non-spatial data,
activate No geometry (attribute only table) and it
will be loaded as an ordinal table.
また、以下を有効にできます:
- Use spatial index to improve the performance of
displaying and spatially selecting features;
- Use subset index;
- Watch file to watch for changes to the file by other
applications while QGIS is running.
DXFまたはDWGファイルをインポートする
DXF and DWG files can be added to QGIS by simple drag-and-drop from the common Browser Panel. You’ll be prompted to select the sublayers you’d like to add to the project. Layers are added with random style properties.
ノート
いくつかのジオメトリタイプ(ポイント、ライン、および/またはポリゴン)を含むDXFファイルは、レイヤーの名前は <filename.dxf>エンティティ <geometry type> から作られます。
To keep the dxf/dwg structure and its symbology in QGIS, you may want to use the dedicated Project ‣ DWG/DXF Import... tool. Indeed, the DWG/DXF Import dialog allows you to import into GeoPackage database any element of the drawing file.
In the dialog, you have to:
- Input a location for a GeoPackage file, that will be created to store the DWG/DXF content to;
- Specify which coordinate system the data in the DWG data is in;
- Then use the [Import] button to select the DWG/DXF file to use (one per geopackage). The GeoPackage database will be automatically populated with the drawing file content. Depending on the size of the *CAD file, this could take some time;
- The Expand block references will transform the existing
blocks into normal elements;
- the Use curves promotes the output layers geometry type
to a curved one.
After the .dwg or .dxf data is imported into the GeoPackage database the frame in the lower half of the dialog is populated with the list of layers from the imported file. There you can select which layers to add to the QGIS project:
- At the top, set a Group name to group the drawing files in the project;
- Check layers to show: Each selected layer is added to an ad hoc group which contains vector layers for the point, line, label and area features of the drawing layer. The style of each layer is setup so that it resembles the look it originally had in *CAD;
- Check whether layer should be visible at opening;
- Alternatively using the Merge layers option places all
layers in a single group;
- Press [OK] to open the layers in QGIS.
OpenStreetMapベクターをインポートする
多くの国で、このようなデジタル道路地図などの無料の地理データが利用できないため、近年では、OpenStreetMapのプロジェクトが人気を博しています。OSMプロジェクトの目的は、GPSデータ、航空写真や地元の知識から、世界の自由な編集可能な地図を作成することです。この目的をサポートするために、QGISはOSMデータのサポートを提供します。
ブラウザパネル を使用して .osm ファイルを地図キャンバスにロードできます。この場合、ジオメトリタイプに基づいてサブレイヤを選択するダイアログが表示されます。ロードされたレイヤーには、ファイル内にそのジオメトリタイプのすべてのデータが格納され、 osm ファイルのデータ構造が保持されます。
To avoid working with a such complex data structure, and be able to select only features you need based on their tags, QGIS provides a core and fully integrated OpenStreetMap import tool:
- To connect to the OSM server and download data, open the menu Vector ‣ OpenStreetMap ‣ Download data.... You can skip this step if you already obtained an .osm XML file using JOSM, Overpass API or any other source;
- The menu Vector ‣ OpenStreetMap ‣ Import Topology from XML... will convert your .osm file into a SpatiaLite database and create a corresponding database connection;
- The menu Vector ‣ OpenStreetMap ‣ Export Topology to
SpatiaLite... then allows you to open the database connection, select the
type of data you want (points, lines, or polygons) and choose tags to import.
This creates a SpatiaLite geometry layer that you can add to your
project by clicking on the
 Add SpatiaLite Layer toolbar button or by selecting the
Add SpatiaLite Layer... option
from the Layer menu (see section SpatiaLite レイヤー).
Add SpatiaLite Layer toolbar button or by selecting the
Add SpatiaLite Layer... option
from the Layer menu (see section SpatiaLite レイヤー).
GRASS
GRASSベクターデータでの作業は、 GRASS GIS の統合 セクションに記載されています。
SpatiaLite レイヤー
初めてSpatiaLiteデータベースからデータをロードするときは、以下で始めます:
- SpatiaLiteレイヤーを追加 ツールバーボタンをクリックします。
レイヤー ‣ レイヤーを追加 メニューから
SpatiaLiteレイヤーを追加... オプションを選択します;または入力して Ctrlキー+Shiftキー+L 。
This will bring up a window that will allow you either to connect to a SpatiaLite database already known to QGIS, which you can choose from the drop-down menu, or to define a new connection to a new database. To define a new connection, click on [New] and use the file browser to point to your SpatiaLite database, which is a file with a .sqlite extension.
QGISもSpatiaLiteで編集可能なビューをサポートしています。
データベース関連ツール
ストアドコネクションを作成する
In order to read and write tables from the many database formats QGIS supports you’ll need to create a connection to that database. While QGIS Browser Panel is the simplest and recommanded way to connect and use databases within, QGIS provides specific tools you can use to connect to each of them and load their tables:
 Add PostGIS Layer... or by typing
Ctrl+Shift+D
Add PostGIS Layer... or by typing
Ctrl+Shift+D Add MSSQL Spatial Layer or by typing
Ctrl+Shift+M
Add MSSQL Spatial Layer or by typing
Ctrl+Shift+M Add Oracle Spatial Layer... or typing
Ctrl+Shift+O
Add Oracle Spatial Layer... or typing
Ctrl+Shift+O Add DB2 Spatial Layer... or typing
Ctrl+Shift+2
Add DB2 Spatial Layer... or typing
Ctrl+Shift+2
これらのツールは レイヤー管理ツールバー または レイヤー ‣ レイヤーを追加 ‣ メニューからアクセスできます。 SpatiaLiteデータベースへの接続については、 SpatiaLite レイヤー を参照してください。
ちなみに
QGISブラウザパネルからデータベースへの接続を作成します
ブラウザツリーで対応するデータベース形式を選択し、右クリックして[接続]を選択するとデータベース接続ダイアログが表示されます。
Most of the connection dialogs follow a common basis that will be described below using the PostGreSQL database tool as example.
The first time you use a PostGIS data source, you must create a connection to a database that contains the data. Begin by clicking the appropriate button as exposed above, opening an Add PostGIS Table(s) dialog (see figure_add_postgis_tables). To access the connection manager, click on the [New] button to display the Create a New PostGIS Connection dialog.
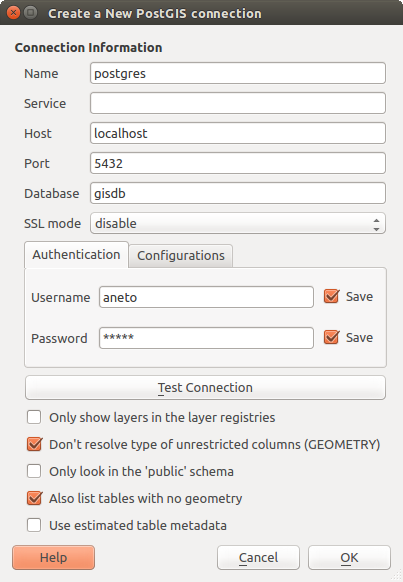
[新規PostGIS接続を作成]ダイアログ
PostGIS接続に必要なパラメーターは以下のとおりです。その他のデータベース型については、 特定の接続要件 でその違いを参照してください。
Name: このコネクションの名前。 Database と同じにできます。
サービス:ホスト名/ポート(および潜在的にデータベース)に代わりに使用されるサービスパラメーター。これは pg_service.conf 中で定義できます。詳細は PG-サービス-file セクションを確認してください。
DB2ホスト :データベースホストの名前。これは、TCP/IP接続を開くかまたはホストにpingを実行するために使用されるような解決可能なホスト名でなければなりません。データベースがQGISと同じコンピュータ上にある場合は、単にここに localhost と入力します。
Port: PostgreSQL データベースサーバが接続待ちをしているポート番号。PostGIS の デフォルトポートは 5432 です.
データベース: データベースの名称
SSLモード:SSL接続がサーバと交渉する方法。PostGISのレイヤーのレンダリングでの大幅な高速化は、接続エディタでSSLを無効にすることによって達成できることに注意してください。次のオプションが用意されています。
Disable: 暗号化されていないSSL接続の場合のみ試みる
Allow: SSLコネクションの試行に失敗した場合非SSLコネクションの試行をする.
Prefer (デフォルト): SSLコネクションを試行します.もし失敗したら非SSLコネクションを試行します;
必須 :SSL接続のみを試します。
Username: データベースにログインするユーザー名.
Password: データベースに接続するために Username と一緒に利用するパスワード.
You can save any or both of the username and password parameters, in which case they will be used by default each time you need to connect to this database. If not saved, you’ll be prompted to fill the missing credentials to connect to the database in next QGIS sessions; meanwhile the connection parameters you entered are stored in a temporary internal cache and returned whenever a username/password for the same database is requested, until you close the current QGIS process.
警告
QGISユーザー設定とセキュリティ
Authentication タブ、 ユーザー名 と パスワード を保存するには、接続構成で保護されていない資格情報を維持します。例えば、誰かとプロジェクトファイルを共有し、あればそれら 資格情報 は表示されます。したがって、代わりに認証情報を 認証設定 ( configurations タブ、詳細は 認証システム 参照)で、またはサービス接続ファイルに保存することをお勧めします(例えば pg-service -file 参照)。
オプションで、データベースのタイプに応じて以下のチェックボックスをアクティブにできます:
- レイヤーレジストリにあるレイヤーのみ表示
- 制限されていない列(GEOMETRY)の型解決を行わない
- 「パブリック」スキーマのみを参照する
- ジオメトリを持たないテーブルもリストする
- 推定されるテーブルメタデータを利用する
ちなみに
作業をスピードアップするために推定テーブルのメタデータを使用します
レイヤーを初期化するとき、様々なクエリは、データベーステーブルに格納されたジオメトリの特性を確立するために必要とされるかもしれません。 推定されたテーブルメタデータを使用 オプションがチェックされた場合は、これらのクエリは、行のサンプルだけを検査し、全体ではなく、テーブルよりも、テーブルの統計情報を使用しています。これは実際には大規模なデータセットの操作を大幅に高速化できますが、レイヤーの不正確な特性をもたらすことがあり(例えばフィルタされたレイヤーの地物数は正確に決定されることはないでしょう)、ユニークと想定されている列がそうでなかった場合に奇妙な行動を引き起こす可能性さえあります。
Once all parameters and options are set, you can test the connection by clicking on the [Test connection] button or apply it hitting [OK]. From the Add PostGIS Table(s), click now on [Connect] and the dialog is filled with tables from the selected database (as shown in figure_add_postgis_tables).
特定の接続要件
そのため、データベースのタイプの特殊性のため、提供されるオプションは、すべてのデータベースに対するすべて同じです。以下は、これらの接続特異性を暴露しています。
PostgreSQLサービス接続ファイル
サービスの接続ファイルで、PostgreSQLの接続パラメーターを単一のサービス名に関連づけできます。そのときサービス名はクライアントによって指定でき、関連する設定が使用されます。
それは*nixシステム下(GNU / Linux、MacOSのなど) .pg_service.conf 、Windowsでは pg_service.conf と呼ばれています。
サービスファイルは次のようになります:
[water_service]
host=192.168.0.45
port=5433
dbname=gisdb
user=paul
password=paulspass

[wastewater_service]
host=dbserver.com
dbname=water
user=waterpass
ノート
上記の例では2つのサービスがあります: water_service と wastewater_service 。それに接続したいサービスの名前だけ(囲む括弧なし)を指定することにより、QGIS、pgAdminでなどから接続するためにこれらを使用できます。 psql でサービスを利用したい場合、psqlのコマンドを実行する前に export PGSERVICE=water_service のような何かをする必要があります。
ノート
すべてのパラメーターは ここ で見つかります
ノート
サービスファイルにパスワードを保存したくない場合は、 .pg_pass オプションを使用できます。
*nixのオペレーティング・システム(GNU / Linux、MacOSなど)では、 .pg_service.conf ファイルはユーザのホームディレクトリに保存でき、PostgreSQLのクライアントが自動的にそれに気付くでしょう。例えば、ログインしたユーザーが web であれば、 .pg_service.conf が直接機能する(他の環境変数を指定せずに)ためには /home/web/ ディレクトリに保存する必要があります。。
例えば、一時的に設定するために*nixのOSの下で 輸出PGSERVICEFILE = /ホーム/ウェブ/ .pg_service.conf``コマンドを実行します( `` PGSERVICEFILE``環境変数を作成することにより、サービスファイルの場所を指定できます PGSERVICEFILE``変数)
以下いずれかにょってもサービスファイルをシステム全体(すべてのユーザー)で利用可能にできます: pg_config --sysconfdir 内 .pg_service.conf を配置する、またはサービスファイルを含むディレクトリを指定するために PGSYSCONFDIR 環境変数を追加する。ユーザーとシステムファイルに同じ名前のサービス定義が存在する場合、ユーザーのファイルが優先されます。
警告
Windowsでいくつかの注意点があります。
サービスファイルは .pg_service.conf として、 pg_service.conf でなく、保存する必要があります。
サービスファイルが機能するためには、Unixの形式で保存する必要があります。それを行うための1つの方法は、 メモ帳++ でそれを開き 編集 ‣ EOL変換 ‣ UNIX形式 ‣ ファイル保存 。
環境変数はさまざまな方法で追加できます;テストされており、信頼できる動作をするとわかっているものは、 コントロールパネル ‣ システムとセキュリティ ‣ システム ‣ 高度なシステム設定 ‣ 環境変数 、 PGSERVICEFILE および タイプのパス C:\Users\John\pg_service.conf タイプのパスを追加して。
環境変数を追加した後は、コンピュータを再起動する必要もあるかもしれません。
Oracle Spatialのへの接続
Oracleデータベース内のネイティブ型では地理的位置データを管理する上でのOracle Spatialの援助のユーザーの空間の特徴。のオプションのいくつかに加えて ストアドコネクションを作成する 、接続ダイアログが提案しています:
Database :OracleインスタンスのSID または SERVICE_NAME.
Port: Oracle データベースサーバーが接続待ちをしているポート番号。デフォルトポートは 1521 です。
ワークスペース:ワークスペースに切り替えます。
必要に応じて、次のチェックボックスを有効にすることができます。
- Only look in metadata table: restricts the displayed
tables to those that are in the all_sdo_geom_metadata view. This can
speed up the initial display of spatial tables;
- Only look for user’s tables: when searching for spatial
tables, restrict the search to tables that are owned by the user;
- Also list tables with no geometry: indicates that
tables without geometry should also be listed by default;
- Use estimated table statistics for the layer metadata:
when the layer is set up, various metadata are required for the Oracle table.
This includes information such as the table row count, geometry type and
spatial extents of the data in the geometry column. If the table contains a
large number of rows, determining this metadata can be time-consuming. By
activating this option, the following fast table metadata operations are
done: Row count is determined from all_tables.num_rows. Table extents
are always determined with the SDO_TUNE.EXTENTS_OF function, even if a layer
filter is applied. Table geometry is determined from the first 100
non-null geometry rows in the table;
- Only existing geometry types: only list the existing
geometry types and don’t offer to add others;
- 追加のジオメトリ属性を含める 。
ちなみに
Oracle Spatialのレイヤー
通常 ORACLE Spatial レイヤーは USER_SDO_METADATA テーブルのエントリで定義されています.
DB2 Spatialに接続する
ストアドコネクションを作成する に記載されているオプションのいくつかに加えて、ODBCに定義されたService/DSN名を使用してDB2データベース(詳細は DB2 空間レイヤー を参照)への接続を指定するか、ドライバ、ホスト、およびポートの情報。
ODBC サービス/DSN 接続はODBCに定義されたサービス名が必要です。
ドライバ/ホスト/ポート接続が必要です。
ドライバ :DB2ドライバの名前。通常、これはIBM DB2 ODBCドライバになります。
DB2ホスト :データベースホストの名前。これは、TCP/IP接続を開くかまたはホストにpingを実行するために使用されるような解決可能なホスト名でなければなりません。データベースがQGISと同じコンピュータ上にある場合は、単にここに localhost と入力します。
DB2ポート :DB2データベース・サーバーが待機するポート番号。デフォルトDB2 LUWポートは 50000 です。デフォルトのDB2 z / OSのポートは、 446 です。
ちなみに
DB2 Spatialのレイヤー
DB2空間レイヤーは DB2GSE.ST_GEOMETRY_COLUMNS ビューの行によって定義されます。
ノート
QGISのDB2空間テーブルを効果的に使用するには、表にINTEGERまたはBIGINT列がPRIMARY KEYとして定義されていることが重要です。また、新しい機能を追加する場合は、この列もGENERATED特性を持つ必要があります。
また、空間列を特定の空間参照識別子(WGS84座標の場合は「4326」)に登録すると便利です。空間列は、 ST_Register_Spatial_Column ストアドプロシージャを呼び出すことで登録できます。
MSSQL空間への接続
ストアドコネクションを作成する のオプションのいくつかに加えて、新しいMSSQL接続ダイアログを作成すると、 Provider/DSN の名前を入力するよう提案されます。使用可能なデータベースを表示することもできます。
データベースレイヤーをロードする
データベースに定義された1つまたは複数の接続を持っていたら( ストアドコネクションを作成する セクションを参照してください)、それからレイヤーを読み込むことができます。もちろん、これは、利用可能なデータを持つ必要です。PostGISのデータベースにデータをインポートについての議論については PostgreSQLへデータをインポートする などを参照してください。
データベースからレイヤーをロードするには、以下のステップを実行できます:
- Open the “Add <database> table(s)” dialog (see ストアドコネクションを作成する),
- Choose the connection from the drop-down list and click [Connect].
- ジオメトリを持たないテーブルもリストする を選択または非選択にできます
- Optionally, use some Search Options to reduce the
list of tables to those matching your search. You can also set this option
before you hit the [Connect] button, speeding this way the database
fetching.
有効なレイヤーリスト中で使用したいレイヤーを探してください.
クリックしてそれを選択します。クリック時に Shiftキー を押し続けることで、複数のレイヤーを選択できます。
- If applicable, use the [Set Filter] button (or double-click the layer) to start the Query builder dialog (See section クエリビルダー) and define which features to load from the selected layer. The filter expression appears in the sql column. This restriction can be removed or edited in the Layer Properties ‣ General ‣ Provider Feature Filter frame.
- The checkbox in the Select at id column that is activated by default gets the features ids without the attributes and speed in most cases the data loading.
- Click on the [Add] button to add the layer to the map.
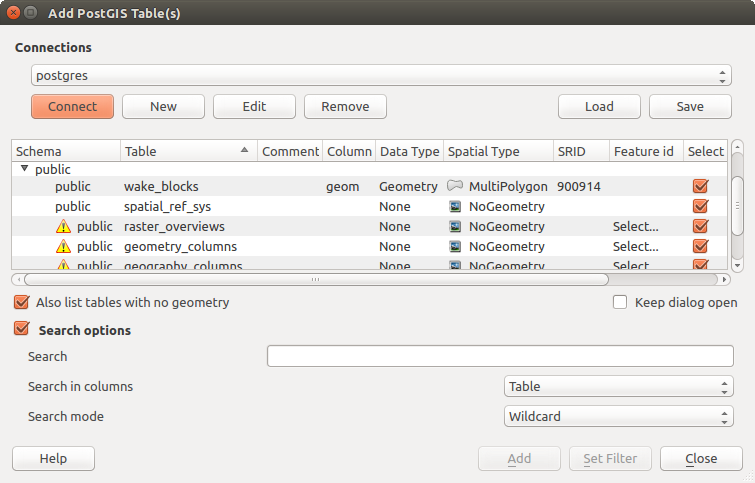
PostGISテーブルを追加ダイアログ
ちなみに
Load database table(s) from the Browser Panel
Like simple files, connected database are also listed in the Browser Panel. Hence, you can load tables from databases using the Browser:
- Find the layer to use with the Filter Browser tool at
the top the browser panel (see ブラウザパネル for the search options);
- select and drag-and-drop it in the map canvas.
QGISカスタムフォーマット
QGISでは、独自のロードツールを使用してアプリケーションにロードできる2つのカスタムフォーマットを提案しています:
一時的な落書きレイヤー:開いているプロジェクトにバインドされているメモリレイヤー(詳細は 新しい一時的な落書きレイヤーを作成する を参照)
仮想レイヤー:他のレイヤーに対するクエリの結果として得られるレイヤー(詳細は Creating virtual layers を参照)
ウェブサービスへ接続する
QGISを使用すると、さまざまな種類のOGC Webサービス (WM(T)S, WFS(-T), CSW ...)にアクセスできます。 QGIS サーバーのおかげで、これらのサービスを公開することもできます。これらの機能と使用方法については、 OGCデータの操作 の章で説明しています。