15.9. Lesson: 地図プレゼンテーション
以前のレッスンでは、GISプロジェクトとして古い森林調査をインポートし、それを現在の状況に更新し、森林調査を設計し、フィールドワークの地図を作成し、フィールド測定から森林のパラメーターを算出しました。
GISプロジェクトの結果で地図を作成することはしばしば重要です。森林調査の結果を提示する地図によって、特定の数字を見なくても、結果が何であるか誰にでも一目でわかりやすくなるでしょう。
このレッスンの目標: 調査結果を提示する地図を、陰影起伏ラスターを背景に使用して作成します。
15.9.1.  Follow Along: 地図データを準備する
パラメーター計算のレッスンからのQGISプロジェクトを開きます、 forest_inventory.qgs 。少なくとも以下のレイヤーを保管してください:
- forest_stands_2012_results.
- basic_map.
- rautjarvi_aerial.
lakes (それを持っていない場合は、exercise_data\forestry\ フォルダからそれを追加します)。
You are going to present the average volumes of your forest stands in a map. If you open the Attribute table for the forest_stands_2012_results layer, you can see the NULL values for the stands without information. To be able to get also those stands into your styling you should change the NULL values to, for example, -999, knowing that those negative numbers mean there is no data for those polygons.
forest_stands_2012_results レイヤ に対して:
属性テーブル を開き編集を可能にします。
NULL 値を持つポリゴンを選択します。
選択された地物だけに対して、計算機を使用して MEANVol フィールドの値を -999 に更新します。
編集を無効にし、変更を保存します。
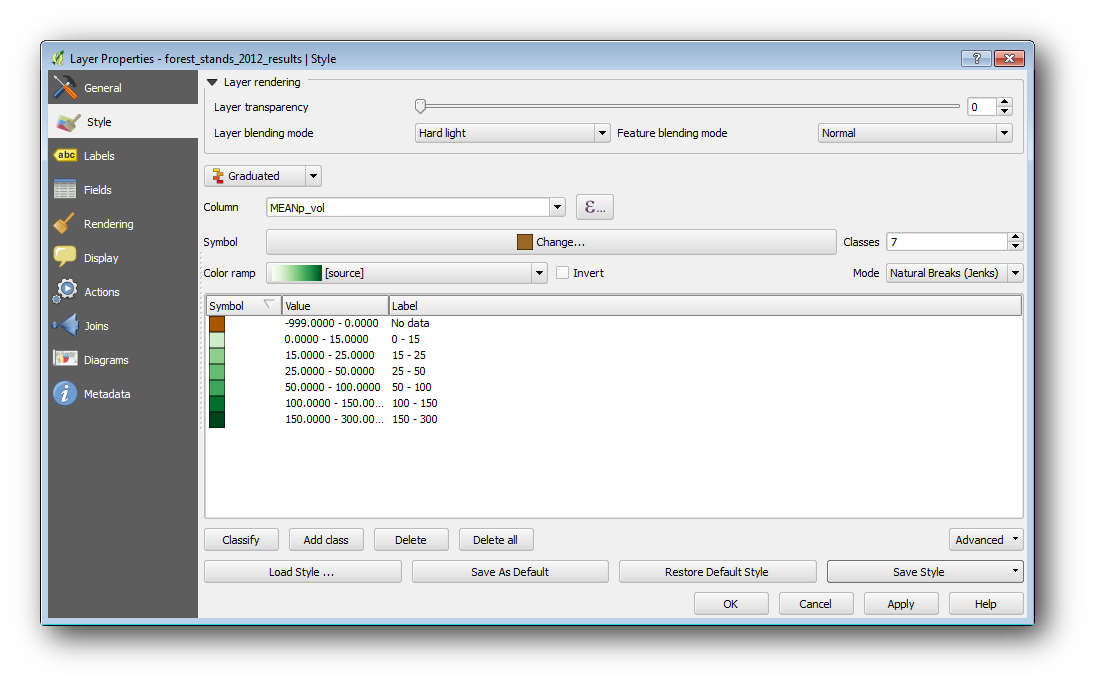
今、保存されたスタイルをこのレイヤーに使用できます。
- Go to the Style tab.
- Click on Load Style.
exercise_data\forestry\results\ フォルダから forest_stands_2012_results.qml を選択します。
OK をクリックします。
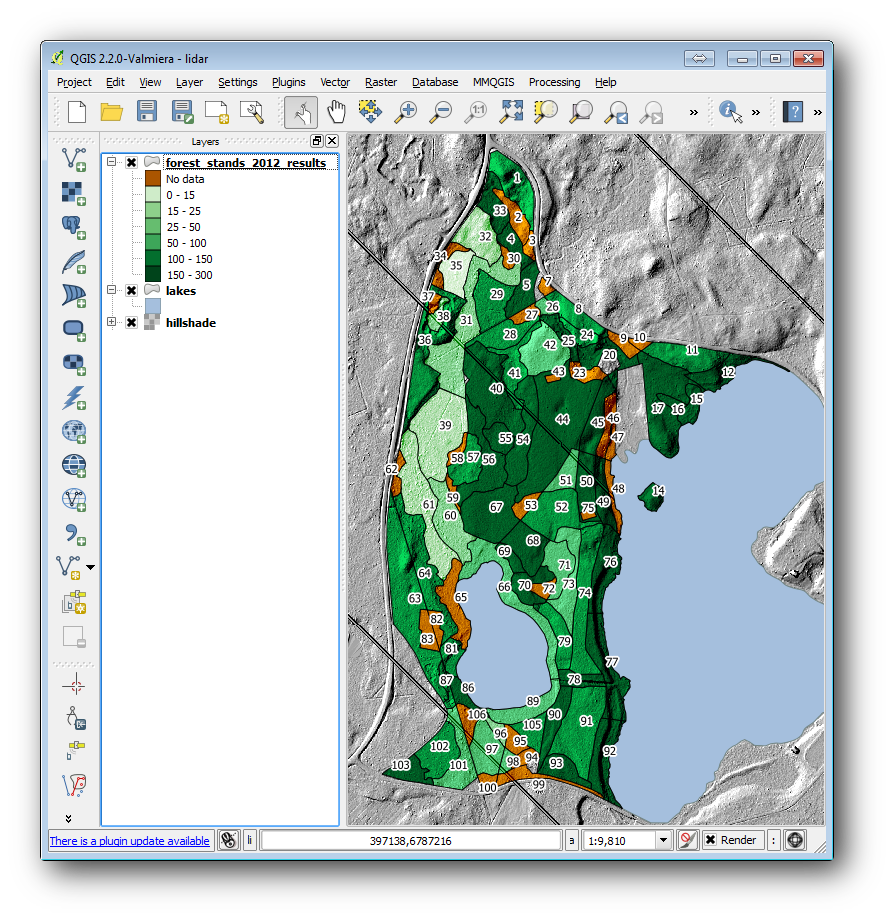
地図は次のようになります。
15.9.2. Try Yourself さまざまなブレンドモードを試す
ロードしたスタイル:
is using the Hard light mode for the Layer blending mode. Note that the different modes apply different filters combining the underlying and overlying layers, in this case the hillshade raster and your forest stands are used. You can read about these modes in the User Guide.
異なるモードで試してみて、地図の違いを見てください。それから、より好きな方を最終的な地図として選択してください。
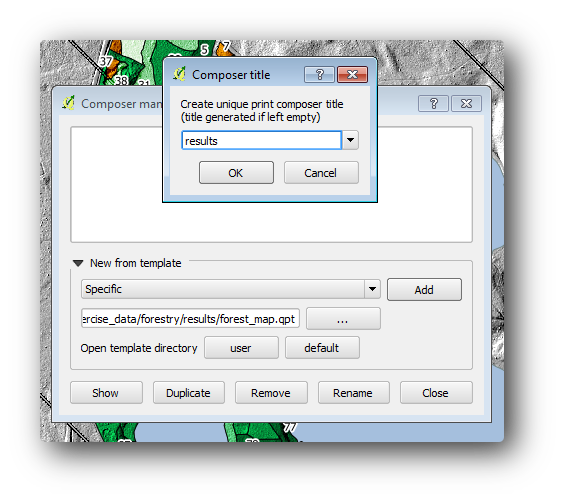
15.9.3. Try Yourself Using a Composer Template to Create the Map result
Use a template prepared in advanced to present the results. The template forest_map.qpt is located in the exercise_data\forestry\results\ folder. Load it using the Project ‣ Composer Manager... dialog.
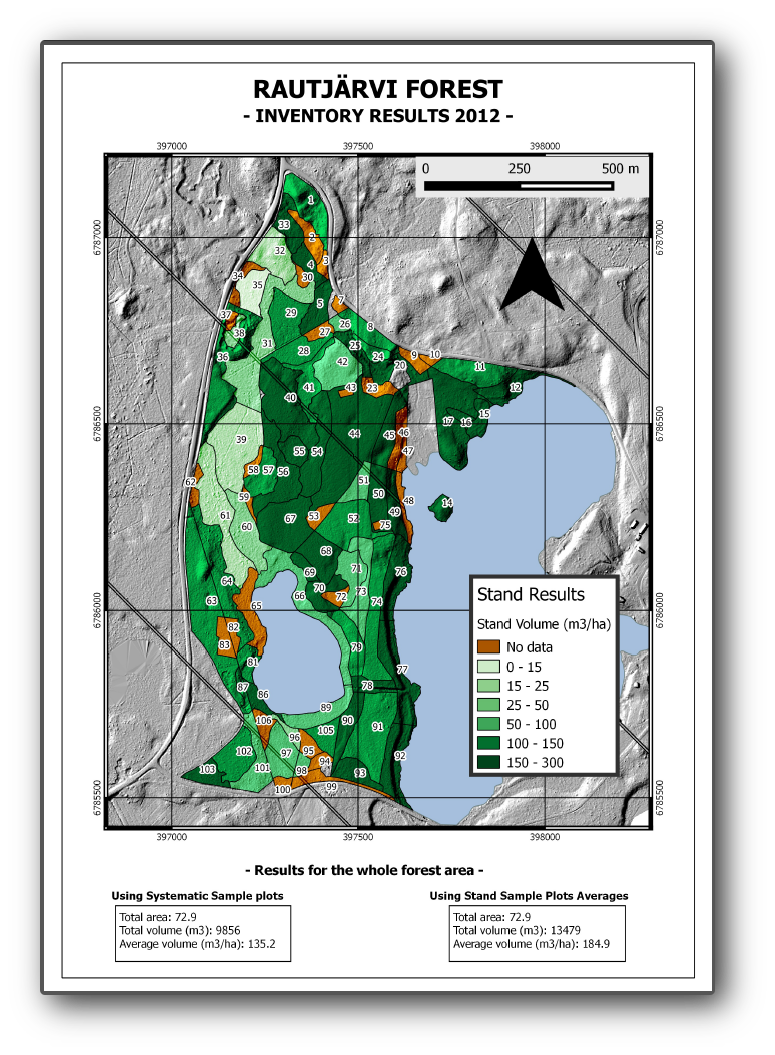
Open the map composer and edit the final map to get a result you are happy with.
使用している地図テンプレートは、これと同じ地図を提供します:
将来の参照のためQGISプロジェクトを保存します。
15.9.4. In Conclusion
このモジュールを通して、基本的な森林調査を計画し、QGISで提示する方法を見てきました。アクセスできるさまざまなツールでさらに多くの森林の分析が可能ですが、このマニュアルがご自身が必要とする結果を達成する方法を探るための良い出発点になればと思います。