15.7. Lesson: 森林パラメーターを計算する
森林のパラメーターを推定することは、森林調査の目標です。前のレッスンからの例を続け、野外で収集された調査情報を使用し、最初に森林全体に対して、それから前にデジタル化した林分に対して、森林のパラメーターを計算しましょう。
このレッスンの目標: 一般と林分レベルで森林のパラメーターを計算します。
15.7.1.  Follow Along: 調査結果を追加
野外チームは森林を訪問し、こちらから提供する情報の助けを借りて、すべてのサンプルプロットでの森林に関する情報を集めました。
Most often the information will be collected into paper forms in the field, then typed to a spreadsheet. The sample plots information has been condensed into a .csv file that can be easily open in QGIS.
Continue with the QGIS project from the lesson about designing the inventory, you probably named it forest_inventory.qgs.
まず、QGIS プロジェクトにサンプルプロットの測定を追加します。
レイヤー - >区切りのテキストレイヤーを追加... に行きます。
- Browse to the file systematic_inventory_results.csv located in exercise_data\forestry\results\.
ポイント座標 オプションがチェックされていることを確認します。
- Set the fields for the coordinates to the X and Y fields.
OK をクリックします。
- When prompted, select ETRS89 / ETRS-TM35FIN as the CRS.
新しいレイヤーの 属性テーブル を開いてデータを見てみましょう。
You can read the type of data that is contained in the sample plots measurements in the text file legend_2012_inventorydata.txt located in the exercise_data\forestry\results\ folder.
The systematic_inventory_results layer you just added is actually just a virtual representation of the text information in the .csv file. Before you continue, convert the inventory results to a real shapefile:
- Right click on the systematic_inventory_results layer.
- Browse to exercise_data\forestry\results\ folder.
- Name the file sample_plots_results.shp.
保存したファイルを地図に追加 をチェックします。
- Remove the systematic_inventory_results layer from your project.
15.7.2. Follow Along: 森林全体のパラメーター推定
You can calculate the averages for this whole forest area from the inventory results for the some interesting parameters, like the volume and the number of stems per hectare. Since the systematic sample plots represent equal areas, you can directly calculate the averages of the volumes and number of stems per hectare from the sample_plots_results layer.
基本統計 ツールを使用して、ベクターレイヤー内のフィールドの平均値を計算できます。
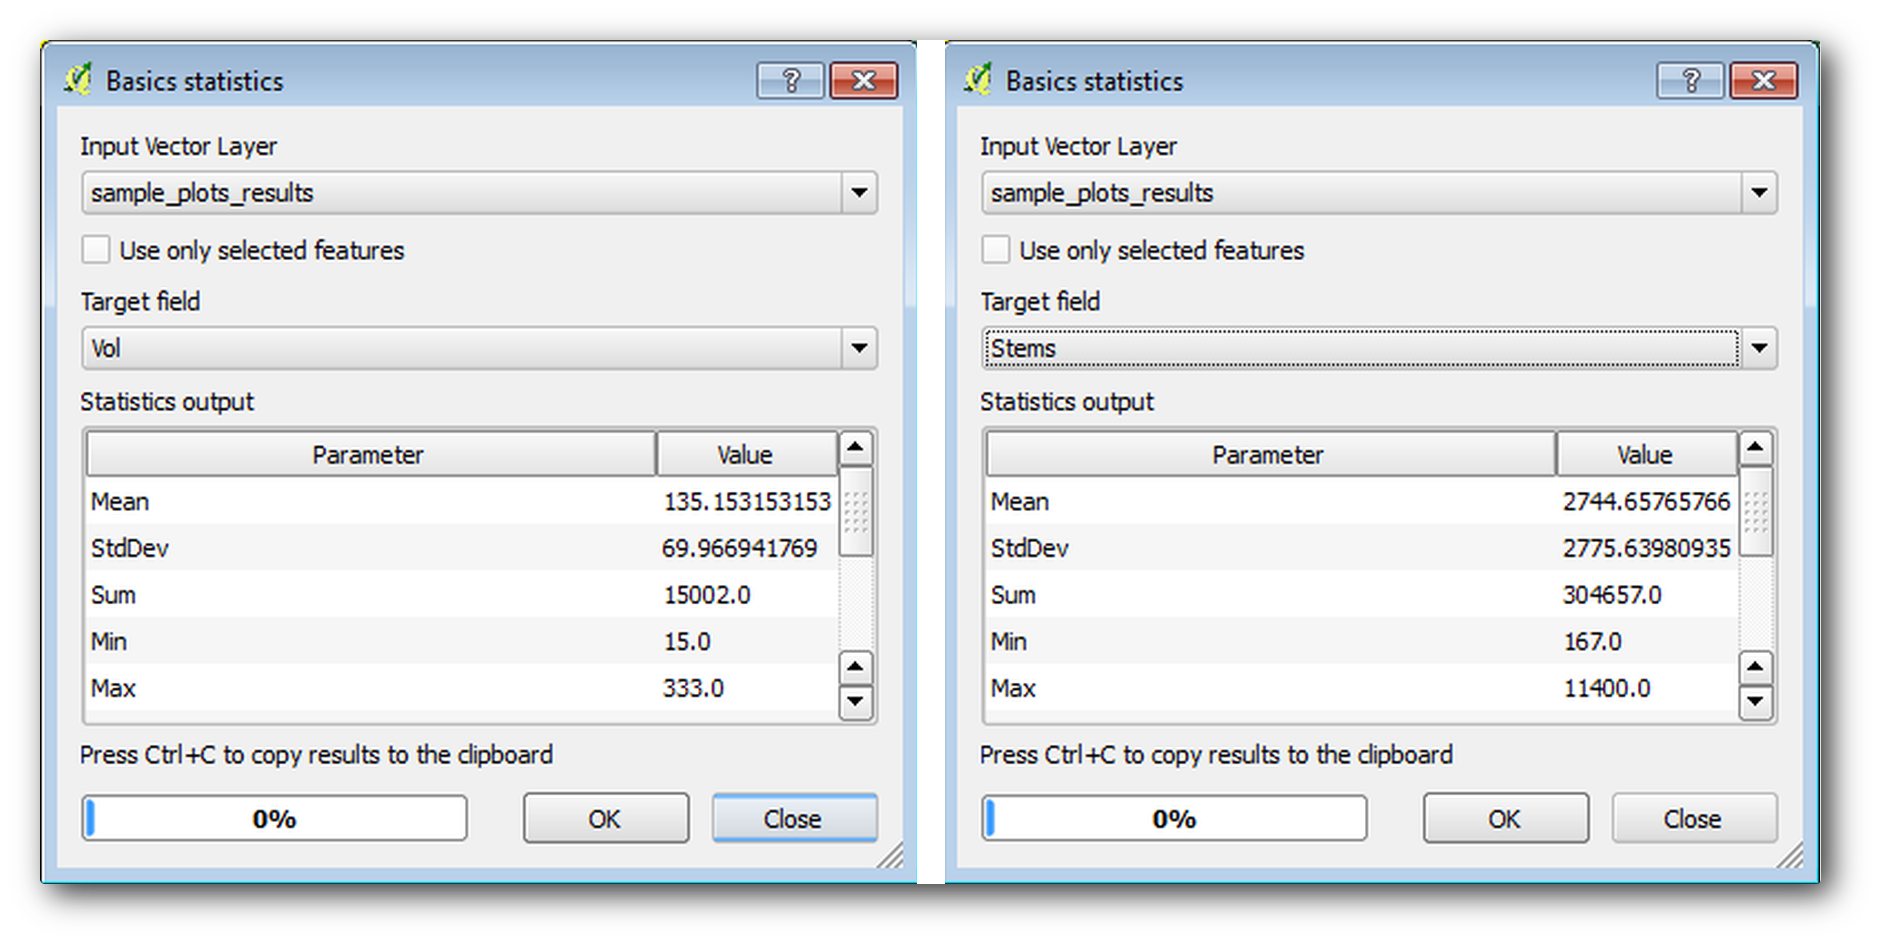
- Open Vector ‣ Analysis Tools ‣ Basic statistics.
- Select the sample_plots_results as the Input Vector Layer.
- Select Vol as Target field.
OK をクリックします。
The average volume in the forest is 135.2 m3/ha.
You can calculate the average for the number of stems in the same way, 2745 stems/ha.
15.7.3. Follow Along: 林分のパラメーターを推定する
以前にデジタル化された別の林分のための推定値を算出するために、同じ体系的サンプルプロットを利用できます。林分の一部はどんなサンプルプロットも取得しておらず、そしてそれらについては情報は取得されないでしょう。体系的な調査を計画するときに、野外チームがこの目的のためにいくつかの余分なサンプルプロットを測定するように、いくつかの余分なサンプルプロットを計画することもできたかもしれません。あるいは後で野外チームを送って不足している林分の見積を取得することで林分の調査を完了することもできたかもしれません。それにもかかわらず、計画されたプロットを使用するだけで林分のかなりの数の情報が得られるでしょう。
必要なのは林分のそれぞれの中に落ちているサンプルプロットの平均値を取得することです。それらの相対的な位置に基づいて情報を組み合わせたいときは、空間的結合を行います:
ベクター ‣ データ管理 ‣ 位置により属性を結合 ツールを開きます。
- Set forest_stands_2012 as the Target vector layer. The layer you want the results for.
- Set sample_plots_results as the Join vector layer. The layer you want to calculate estimates from.
交わる地物を集計 をチェックします。
平均 だけ計算するようチェックしてください。
- Name the result as forest_stands_2012_results.shp and save it in the exercise_data\forestry\results\ folder.
最後に すべてのレコードを保管... を選択し、どの林分が情報を取得していないか、後で内容を確認できるようにします。
OK をクリックします。
プロンプトが表示されたら、プロジェクトに新しいレイヤーを追加し受け入れます。
位置によって属性を結合 ツールを閉じます。
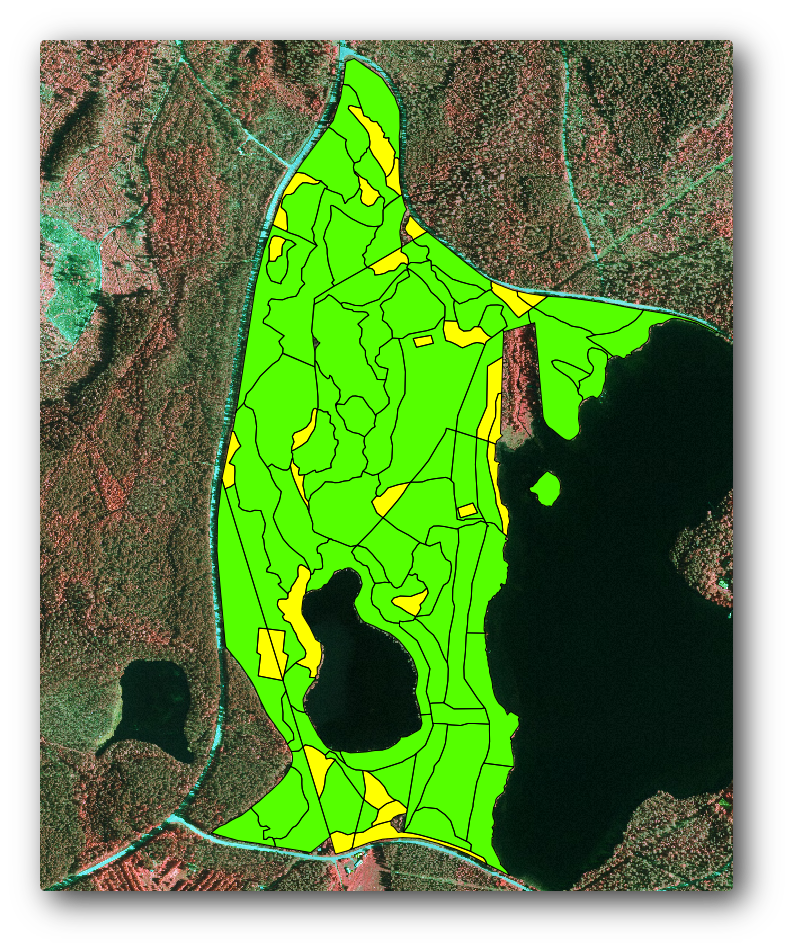
Open the Attribute table for forest_stands_2012_results and review the results you got. Note that a number of forest stands have NULL as the value for the calculations, those are the ones having no sample plots. Select them all review them in the map, they are some of the smaller stands:
Lets calculate now the same averages for the whole forest as you did before, only this time you will use the averages you got for the stands as the bases for the calculation. Remember that in the previous situation, each sample plot represented a theoretical stand of 80x80 m. Now you have to consider the area of each of the stands individually instead. That way, again, the average values of the parameters that are in, for example, m3/ha for the volumes are converted to total volumes for the stands.
最初に林分に対する面積を計算し、それからそれらの各々に対する合計体積および合計茎数を計算する必要があります:
属性テーブル 中で編集を有効にします。
フィールド計算機 を開きます。
- Create a new field called area.
- Leave the Output field type to Decimal number (real).
- Set the Precision to 2.
- In the Expression box, write $area / 10000. This will calculate the area of the forest stands in ha.
OK をクリックします。
ここですべての林分について推定される体積合計および茎数合計を持つフィールドを計算します:
- Name the fields s_vol and s_stem.
フィールドは整数でもよいし、実数も使用できます。
- Use the expressions "area" * "MEANVol" and "area" * "MEANStems" for total volumes and total stems respectively.
終了したら、編集内容を保存します。
編集を無効にします。
以前の状況では、すべてのサンプルプロットによって表される面積が同じだったので、サンプルプロットの平均値を計算すれば十分でした。今は見積もりを計算するためには、林分の体積または茎数の合計を必要な情報を含む林分の面積の合計で割る必要があります。
- In the Attribute table for the forest_stands_2012_results layer, select all the stands containing information.
- Open Vector ‣ Analysis Tools ‣ Basic statistics.
- Select the forest_stands_2012_results as the Input Vector Layer.
- Select area as Target field.
- Check the Use only selected features
OK をクリックします。
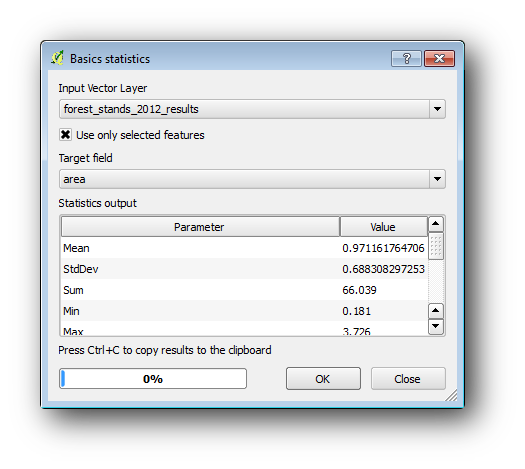
As you can see, the total sum of the stands’ areas is 66.04 ha. Note that the area of the missing forest stands is only about 7 ha.
In the same way, you can calculate that the total volume for these stands is 8908 m3/ha and the total number of stems is 179594 stems.
サンプルプロットから、下記の平均推定値を与えることを使用して林分からの情報を使用して、代わりに直接:
- 184.9 m3/ha and
- 2719 stems/ha.
Save your QGIS project, forest_inventory.qgs.
15.7.4. In Conclusion
自分の体系的なサンプルプロットからの情報を使用して、最初は森林の特性を考慮することなしで、そしてまた林分への空撮画像の解釈を使用して、森林全体に対して森林の推定値を計算できました。また特定の林分に関するいくつかの貴重な情報も得ましたが、これは今後森林の管理を計画するために使用できることでしょう。
15.7.5. What’s Next?
次のレッスンでは、まずレーザー測量データセットから陰影起伏の背景を作成します。これはたった今計算した森林の結果で地図プレゼンテーションを準備するために使用するしょう。