` `
Fenêtre Propriétés d’une couche vecteur
- General Properties
- Style Properties
- Propriétés d’Étiquetage
- Fields Properties
- Propriétés des Jointures
- Propriétés des Diagrammes
- Propriétés des Actions
- Propriétés des Infobulles
- Propriétés de Rendu
- Propriétés des Métadonnées
- Propriétés des Variables
- Propriétés de la Légende
La fenêtre de Propriétés d’une couche vectorielle permet d’accéder aux paramètres généraux pour gérer l’apparence des entités de la couche sur la carte (style, étiquetage, diagrammes) et les interactions avec la souris (actions, infobulles, formulaires). Elle fournit également des informations sur la couche.
To access the Layer Properties dialog, double-click on a layer in the legend or right-click on the layer and select Properties from the pop-up menu.
Note
Depending on the external plugins you have installed, new tabs may be added to the layer properties dialog. Those are not presented below.
Astuce
Live update rendering
The Panneau de style de couche provides you with some of the common features of the Layer properties dialog and is a good modeless widget that you can use to speed up the configuration of the layer styles and automatically view your changes in the map canvas.
Note
Because properties (symbology, label, actions, default values, forms...) of embedded layers (see Inclusion de projets) are pulled from the original project file and to avoid changes that may break this behavior, the layer properties dialog is made unavailable for these layers.
General Properties
 Use this tab to make general settings for the vector layer.
There are several options available:
Use this tab to make general settings for the vector layer.
There are several options available:
Layer Info
- Set the Layer name to display in the Layers Panel
- Display the Layer source of the vector layer
- Define the Data source encoding to define provider-specific options and to be able to read the file
Système de Coordonnées de Référence
- Displays the layer’s Coordinate Reference System (CRS) as a PROJ.4 string.
You can change the layer’s CRS, selecting a recently used one
in the drop-down list or clicking on
 Select CRS button
(see Sélectionneur de système de coordonnées de référence). Use this process only if the CRS applied to the
layer is a wrong one or if none was applied.
If you wish to reproject your data into another CRS, rather use layer reprojection
algorithms from Processing or Save it into another layer.
Select CRS button
(see Sélectionneur de système de coordonnées de référence). Use this process only if the CRS applied to the
layer is a wrong one or if none was applied.
If you wish to reproject your data into another CRS, rather use layer reprojection
algorithms from Processing or Save it into another layer. - Create a Spatial Index (only for OGR-supported formats)
- Update Extents information for a layer
Visibilité dépendante de l’échelle
Vous pouvez définir une échelle Maximum (inclusive) et Minimum (exclusive), correspondant à une plage d’échelles pour lesquelles les entités sont visibles. En dehors de cette plage, elles sont cachées. Le bouton  Mettre à l’échelle actuelle du canevas permet d’utiliser l’échelle actuelle pour l’une ou l’autre des limites de la plage de visibilité. Voir Rendu dépendant de l’échelle pour plus d’informations.
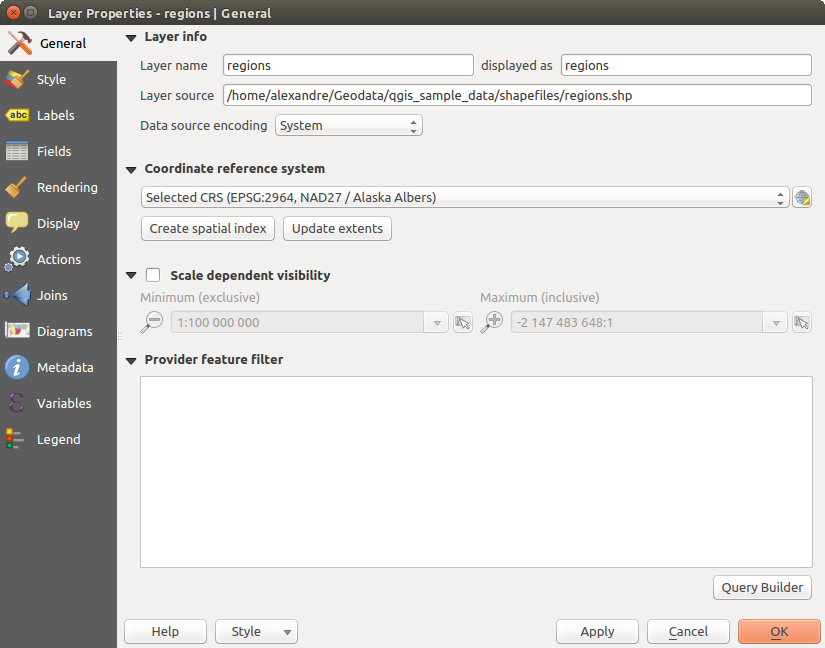
General tab in vector layers properties dialog
Constructeur de requête
Under the Provider Feature Filter frame, the Query Builder allows you to define a subset of the features in the layer using a SQL-like WHERE clause and to display the result in the main window. As long as the query is active, only the features corresponding to its result are available in the project. The query result can be saved as a new vector layer.
The Query Builder is accessible through the eponym term at the bottom of the General tab in the Layer Properties. Under Feature subset, click on the [Query Builder] button to open the Query builder. For example, if you have a regions layer with a TYPE_2 field, you could select only regions that are borough in the Provider specific filter expression box of the Query Builder. Figure_vector_querybuilder shows an example of the Query Builder populated with the regions.shp layer from the QGIS sample data. The Fields, Values and Operators sections help you to construct the SQL-like query.
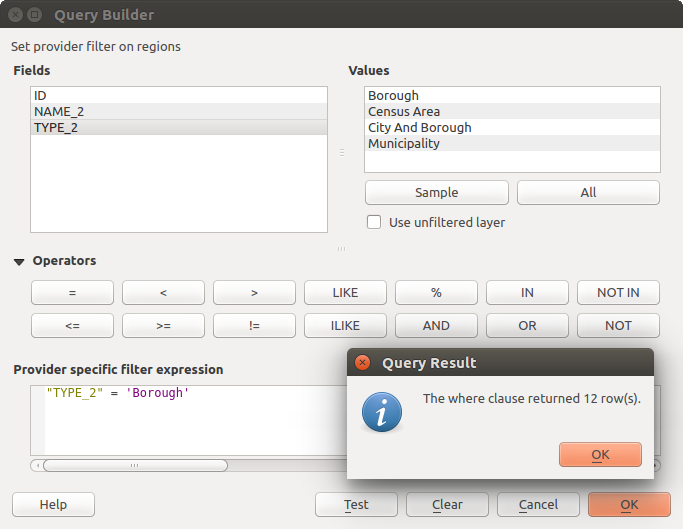
Constructeur de requête
The Fields list contains all attribute columns of the attribute table to be searched. To add an attribute column to the SQL WHERE clause field, double click its name in the Fields list. Generally, you can use the various fields, values and operators to construct the query, or you can just type it into the SQL box.
The Values list lists the values of an attribute table. To list all possible values of an attribute, select the attribute in the Fields list and click the [all] button. To list the first 25 unique values of an attribute column, select the attribute column in the Fields list and click the [Sample] button. To add a value to the SQL WHERE clause field, double click its name in the Values list.
The Operators section contains all usable operators. To add an operator to the SQL WHERE clause field, click the appropriate button. Relational operators ( = , > , ...), string comparison operator (LIKE), and logical operators (AND, OR, ...) are available.
The [Test] button shows a message box with the number of features satisfying the current query, which is useful in the process of query construction. The [Clear] button clears the text in the SQL WHERE clause text field. The [OK] button closes the window and selects the features satisfying the query. The [Cancel] button closes the window without changing the current selection.
QGIS treats the resulting subset acts as if it were the entire layer. For example if you applied the filter above for ‘Borough’, you can not display, query, save or edit Anchorage, because that is a ‘Municipality’ and therefore not part of the subset.
The only exception is that unless your layer is part of a database, using a subset will prevent you from editing the layer.
Style Properties
 The Style tab provides you with a comprehensive tool for
rendering and symbolizing your vector data. You can use tools that are
common to all vector data, as well as special symbolizing tools that were
designed for the different kinds of vector data. However all types share the
following dialog structure: in the upper part, you have a widget that helps
you prepare the classification and the symbol to use for features and at
the bottom the Rendu de couche widget.
The Style tab provides you with a comprehensive tool for
rendering and symbolizing your vector data. You can use tools that are
common to all vector data, as well as special symbolizing tools that were
designed for the different kinds of vector data. However all types share the
following dialog structure: in the upper part, you have a widget that helps
you prepare the classification and the symbol to use for features and at
the bottom the Rendu de couche widget.
Astuce
Exporter le style d’une couche vecteur
Vous avez la possibilité d’exporter la symbologie d’une couche vecteur de QGIS vers les fichiers *.kml de Google, *.dxf et *.tab de MapInfo. Il suffit d’un clic droit sur la couche, puis de cliquer sur Enregistrer sous ‣ pour spécifier le nom du fichier de sortie et son format. Dans la boîte de dialogue, utilisez l’option Exporter la symbologie pour enregistrer la symbologie comme Symbologie de l’entité ou comme Symbologie de la couche de symboles. Si vous avez utilisé des couches de symboles, il est recommandé d’utiliser le deuxième paramètre.
Rendu d’entités
The renderer is responsible for drawing a feature together with the correct symbol. Regardless layer geometry type, there are four common types of renderers: single symbol, categorized, graduated and rule-based. For point layers, there are a point displacement and a heatmap renderers available while polygon layers can also be rendered with the inverted polygons and 2.5 D renderers.
Il n’y a pas de rendu de couleur continue, car il s’agit en fait d’un cas particulier du rendu gradué. Les moteurs de rendu classés et gradués peuvent être créés en spécifiant un symbole et un dégradé de couleur - ils définissent les couleurs pour les symboles de manière appropriée. Pour chaque type de données (points, lignes et polygones), des types de couches de symboles vectoriels sont disponibles. Selon le moteur de rendu choisi, la boite de dialogue fournit différentes sections supplémentaires.
Note
Si, en travaillant sur le style d’une couche vectorielle, vous changez de mode de rendu, les changements effectués sur le symbole sont mémorisés. Notez que cela ne fonctionne qu’une seule fois. Si vous changez à nouveau de mode de rendu, les paramètres seront perdus.
Rendu Symbole Unique
The  Single Symbol renderer is used to render
all features of the layer using a single user-defined symbol.
See The Symbol Selector for further information about symbol representation.
Single Symbol renderer is used to render
all features of the layer using a single user-defined symbol.
See The Symbol Selector for further information about symbol representation.
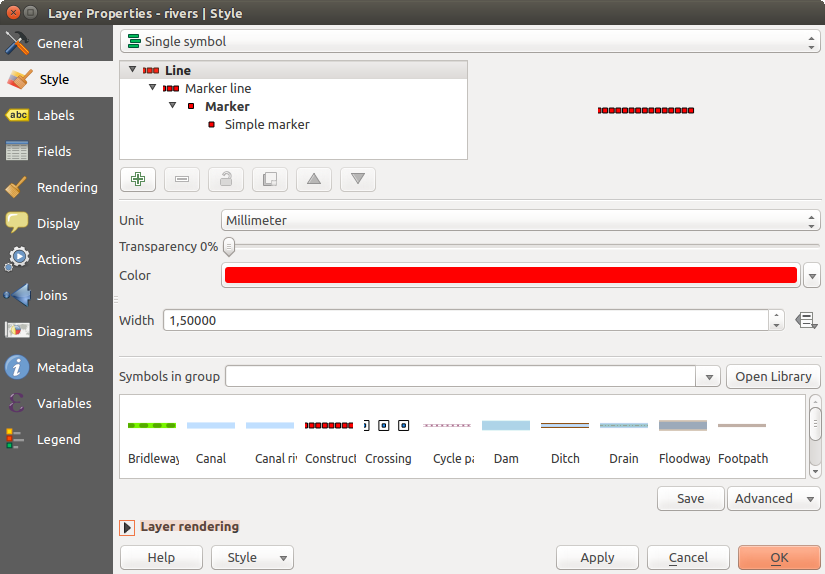
Propriétés “Symbole Unique” de ligne
Astuce
Modifier la symbologie depuis le panneau Couches
If in your Layers Panel you have layers with categories defined through
categorized, graduated or rule-based style mode, you can quickly change the
fill color of the symbol of the categories by right-clicking on a category
and choose the color you prefer from a  color wheel menu.
Right-clicking on a category will also give you access to the options Hide
all items, Show all items and Edit symbol.
color wheel menu.
Right-clicking on a category will also give you access to the options Hide
all items, Show all items and Edit symbol.
Aucun rendu de symbole
Le type de rendu  Aucun Symbole est un cas particulier du rendu en Symbole unique car il applique le même style à toutes les entités. Avec ce rendu, aucun symbole ne sera dessiné pour représenter les entités mais les étiquettes, les diagrammes et tout ce qui ne concerne pas les symboles seront affichés.
Il est toujours possible de faire des sélections sur la couche dans le canevas et les entités sélectionnées seront affichées avec un symbole par défaut. Les entités en cours d’édition seront également affichées.
Cela permet de faire un raccourci pour les couches dont vous voulez uniquement afficher les étiquettes ou les diagrammes et évite de générer des symboles avec un remplissage/bordure complètement transparent.
Rendu Catégorisé
The  Categorized renderer is used to render the
features of a layer, using a user-defined symbol whose aspect reflects the
discrete values of a field or an expression. The Categorized menu allows you to
Categorized renderer is used to render the
features of a layer, using a user-defined symbol whose aspect reflects the
discrete values of a field or an expression. The Categorized menu allows you to
sélectionner un champ existant (en utilisant la liste déroulante Colonne) ;
tapez ou construire une expression en utilisant le
 Calculateur d’expressions. Le résultat de l’expression peut être de n’importe quel type, par exemple :
être une comparaison comme monChamp >= 100, $id = @atlas_featureid, monChamp % 2 = 0, within( $geometry, @atlas_geometry ). Dans ce cas, QGIS renvoie les valeurs 1 (Vrai) ou 0 (Faut).
combiner différents champs, comme concat( champ1, ‘ ‘, champ2 )`, particulièrement utile lorsque vous souhaitez classer vos entités sur les valeurs de deux ou plusieurs champs en même temps.
être un résultat d’un calcul de champs, comme monChamp % 2, year( monChamp ) champ_1 + champ_2`.
transformer des valeurs continues en classes discrètes, comme :
CASE WHEN x > 1000 THEN 'Big' ELSE 'Small' END
combiner plusieurs valeurs discrètes en une seule catégorie, comme :
CASE
WHEN building IN ('residence', 'mobile home') THEN 'residential'
WHEN building IN ('commercial', 'industrial') THEN 'Commercial and Industrial'
END
choisir le symbole (en utilisant la fenêtre The Symbol Selector) qui sera utilisé comme symbole de base pour chaque classe ;
les couleurs (en utilisant la liste des palettes de couleur) parmi lesquelles la couleur appliquée au symbole est choisie.
Then click on [Classify] button to create classes from the distinct value of the attribute column. Each class can be disabled unchecking the checkbox at the left of the class name.
Pour changer le symbole, la valeur et / ou la légende, double-cliquez sur l’élément à modifier.
Un clic-droit vous propose de Copier / Coller, Modifier la couleur, Modifier la transparence, Modifier l’unité de sortie ou Modifier la taille.
L’exemple de la figure figure_categorized_symbology montre le rendu des catégories de la couche des rivières de l’échantillon de données de QGIS.
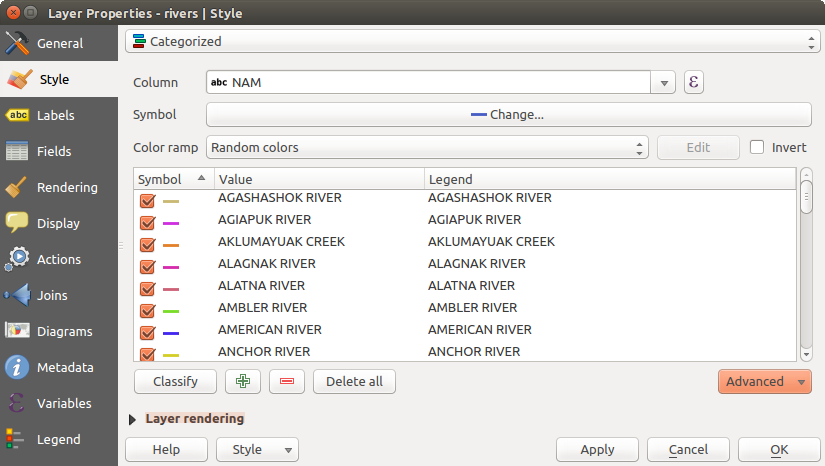
Options du mode de rendu Catégorisé
Astuce
Sélectionner et modifier plusieurs symboles
Il est possible de sélectionner plusieurs symboles, de faire un clic-droit dessus et de changer en une seule opération leur couleur, leur transparence, leur taille ou leur épaisseur.
Astuce
Apparier les catégories aux noms de symboles
Dans le menu [Avancé], sous les classes, vous pouvez choisir l’une des deux premières actions pour faire correspondre le nom du symbole à un nom de catégorie de la classification. Apparier aux symboles sauvegardés fait correspondre un nom de catégorie avec un nom de symbole du Gestionnaire de symboles. Apparier aux symboles à partir du fichier fait correspondre un nom de catégorie à un nom de symbole dans un fichier externe de symboles.
Rendu Gradué
The  Graduated renderer is used to render
all the features from a layer, using an user-defined symbol whose color or size
reflects the assignment of a selected feature’s attribute to a class.
Graduated renderer is used to render
all the features from a layer, using an user-defined symbol whose color or size
reflects the assignment of a selected feature’s attribute to a class.
De la même manière que le rendu catégorisé, le rendu Gradué permet de faire varier l’angle de rotation et la taille des symboles selon les valeurs des champs spécifiés.
De la même façon que le rendu Catégorisé, il vous permet de choisir :
L’attribut (en utilisant la liste déroulante de Colonne ou la fonction
Définir une expression de colonne)le symbole (en utilisant la fenêtre de Sélection de symbole)
Le format de la légende et la précision des valeurs numériques
La méthode à utiliser pour modifier la couleur ou la taille des symboles
Les couleurs (en utilisant la liste des palettes de couleur), si la méthode couleur est sélectionnée
La taille (en choisissant une plage de valeurs et les unités)
Ensuite vous pouvez utiliser l’onglet Histogramme qui permet d’afficher un histogramme interactif des valeurs du champ ou de l’expression utilisé pour le rendu. Les classes peuvent être définies ou ajoutées depuis l’histogramme.
Note
Vous pouvez utiliser le panneau Statistique pour obtenir plus d’information sur votre couche vecteur. Voir Panneau de résumé statistiques.
De retour dans l’onglet Classes, vous pouvez choisir le nombre de classes et la méthode de classification (depuis la liste déroulante Mode). Les modes disponibles sont :
- Equal Interval: each class has the same size (e.g. values from 0 to 16 and 4 classes, each class has a size of 4);
- Quantile: each class will have the same number of element inside (the idea of a boxplot);
- Natural Breaks (Jenks): the variance within each class is minimal while the variance between classes is maximal;
- Standard Deviation: classes are built depending on the standard deviation of the values;
Jolies ruptures: Calcule une séquence d’environ n+1 valeurs d’espacement équidistantes qui couvrent la plage des valeurs de x. Les valeurs sont choisies de sorte qu’elles soient 1, 2 ou 5 fois une puissance de 10. (basé sur ‘jolis points d’arrêt’ de l’environnement statistique de R http://astrostatistics.psu.edu/datasets/R/html/base/html/pretty.html)
The listbox in the center part of the Style tab lists the classes together with their ranges, labels and symbols that will be rendered.
Cliquez sur le bouton Classer pour générer les classes selon le mode choisi. Chaque classe peut être désactivée en décochant la case située à gauche du symbole de classe.
Pour changer le symbole, la valeur et / ou la légende, double-cliquez sur l’élément à modifier.
Un clic-droit vous propose de Copier / Coller, Modifier la couleur, Modifier la transparence, Modifier l’unité de sortie ou Modifier la taille.
L’exemple de la figure figure_graduated_symbology montre le rendu gradué de la couche des rivières de l’échantillon de données de QGIS.
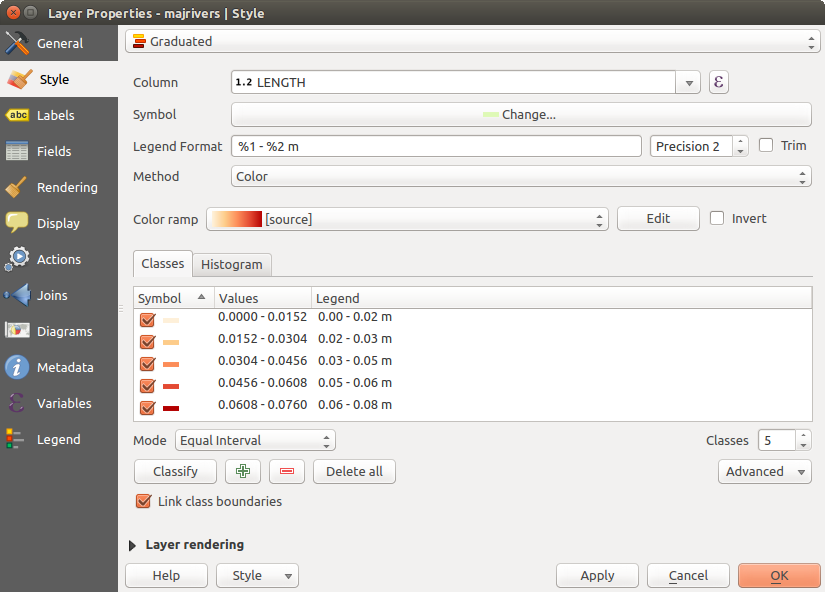
Options du mode de rendu Gradué
Astuce
Cartes thématiques utilisant une expression
Les cartes thématiques faites avec le rendu Catégorisé ou Gradué peuvent être créées en utilisant le résultat d’une expression. Dans la fenêtre Propriétés des couches vectorielles, le sélecteur de colonne accueille une fonction Définir une expression de colonne. Vous n’avez donc pas besoin d’écrire l’attribut de la classification dans une nouvelle colonne de votre table si vous souhaitez que l’attribut de classification soit un composite de plusieurs champs, ou une formule quelconque.
Symboles Proportionnels et Analyse Multivariée
Proportional Symbol and Multivariate Analysis are not rendering types available from the Style rendering drop-down list. However with the Size Assistant options applied over any of the previous rendering options, QGIS allows you to display your point and line data with such representation.
Créer des Symboles Proportionnels
Proportional rendering is done by first applying to the layer the Rendu Symbole Unique.
Once you set the symbol, at the upper level of the symbol tree, the
 Data-defined override button available beside
Size or Width options (for point or line layers
respectively) provides tool to create proportional symbology for the layer.
An assistant is moreover accessible through the menu
to help you define size expression.
Data-defined override button available beside
Size or Width options (for point or line layers
respectively) provides tool to create proportional symbology for the layer.
An assistant is moreover accessible through the menu
to help you define size expression.
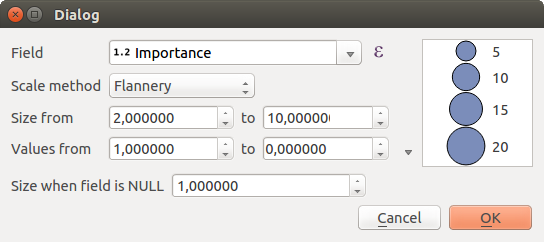
Varying size assistant
The assistant lets you define:
- The attribute to represent, using the Field listbox or the
Set column expression function (see Expressions)
- the scale method of representation which can be ‘Flannery’, ‘Surface’ or ‘Radius’
- The minimum and maximum size of the symbol
- The range of values to represent: The down pointing arrow helps you fill automatically these fields with the minimum (or zero) and maximum values returned by the chosen attribute or the expression applied to your data.
- An unique size to represent NULL values.
To the right side of the dialog, you can preview the features representation within a live-update widget. This representation is added to the layer tree in the layer legend and is also used to shape the layer representation in the print composer legend item.
The values presented in the varying size assistant above will set the size ‘Data-defined override’ with:
coalesce(scale_exp(Importance, 1, 20, 2, 10, 0.57), 1)
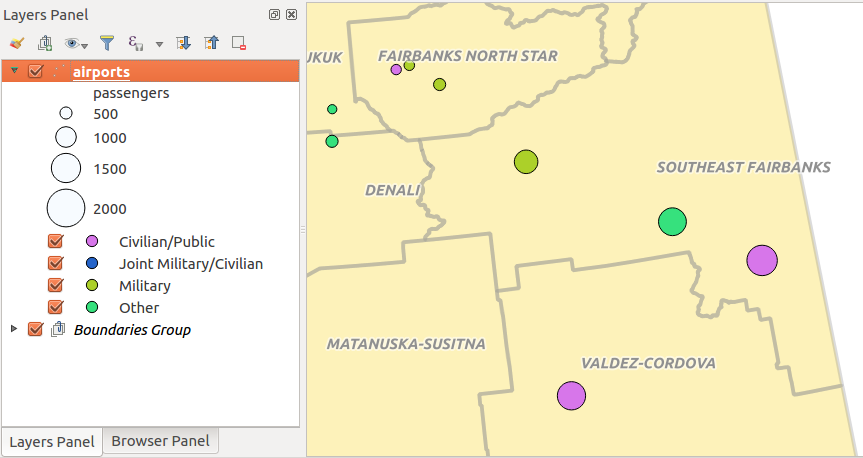
Créer une analyse multivariée
Un rendu d’analyse multivariée vous aide à évaluer la relation entre deux ou plus de variables, par exemple, l’une peut être représenté par une palette de couleur alors que l’autre est représenté par une variation de taille.
The simplest way to create multivariate analysis in QGIS is to first apply a categorized or graduated rendering on a layer, using the same type of symbol for all the classes. Then, clicking on the symbol [Change] button above the classification frame, you get the The Symbol Selector dialog from which, as seen above, you can activate and set the size assistant option either on size (for point layer) or width (for line layer).
Like the proportional symbol, the size-related symbol is added to the layer tree, at the top of the categorized or graduated classes symbols. And both representation are also available in the print composer legend item.
Multivariate example
Rule-based Renderer
The  Rule-based renderer is used to render
all the features from a layer,
using rule-based symbols whose aspect reflects the assignment of a selected
feature’s attribute to a class. The rules are based on SQL statements.
The dialog allows rule grouping by filter or scale, and you can decide
if you want to enable symbol levels or use only the first-matched rule.
Rule-based renderer is used to render
all the features from a layer,
using rule-based symbols whose aspect reflects the assignment of a selected
feature’s attribute to a class. The rules are based on SQL statements.
The dialog allows rule grouping by filter or scale, and you can decide
if you want to enable symbol levels or use only the first-matched rule.
To create a rule, activate an existing row by double-clicking on it, or
click on ‘+’ and click on the new rule. In the Rule properties dialog,
you can define a label for the rule. Press the  button to open the
expression string builder.
In the Function List, click on Fields and Values to view all
attributes of the attribute table to be searched.
To add an attribute to the field calculator Expression field,
double click on its name in the Fields and Values list. Generally, you
can use the various fields, values and functions to construct the calculation
expression, or you can just type it into the box (see Expressions).
You can create a new rule by copying and pasting an existing rule with the right
mouse button. You can also use the ‘ELSE’ rule that will be run if none of the other
rules on that level matches.
Since QGIS 2.8 the rules appear in a tree hierarchy in the map legend. Just
double-click the rules in the map legend and the Style tab of the layer
properties appears showing the rule that is the background for the symbol in
the tree.
button to open the
expression string builder.
In the Function List, click on Fields and Values to view all
attributes of the attribute table to be searched.
To add an attribute to the field calculator Expression field,
double click on its name in the Fields and Values list. Generally, you
can use the various fields, values and functions to construct the calculation
expression, or you can just type it into the box (see Expressions).
You can create a new rule by copying and pasting an existing rule with the right
mouse button. You can also use the ‘ELSE’ rule that will be run if none of the other
rules on that level matches.
Since QGIS 2.8 the rules appear in a tree hierarchy in the map legend. Just
double-click the rules in the map legend and the Style tab of the layer
properties appears showing the rule that is the background for the symbol in
the tree.
L’exemple de la figure figure_rule_based_symbology montre le rendu basé sur des règles pour la couche des rivières de l’échantillon de données de QGIS.
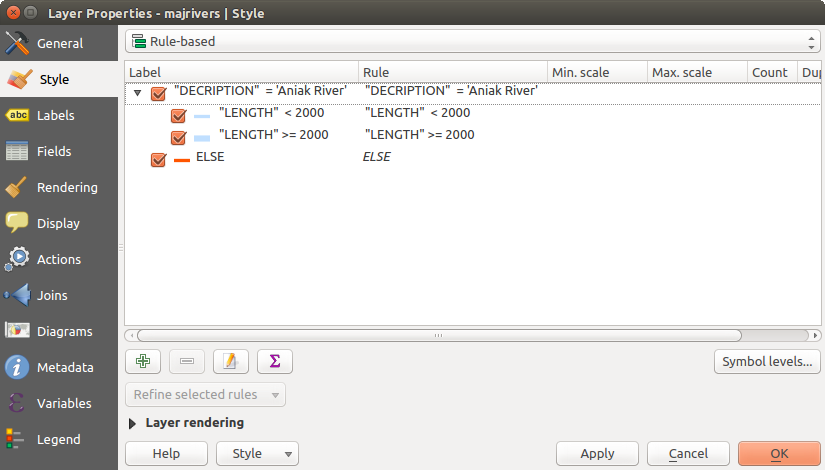
Options du mode de rendu par Ensemble de Règles
Point displacement Renderer
The  Point Displacement renderer
works to visualize all features of a point layer, even if they have the same location.
To do this, the symbols of the points are placed on a displacement circle
around one center symbol or on several concentric circles.
Point Displacement renderer
works to visualize all features of a point layer, even if they have the same location.
To do this, the symbols of the points are placed on a displacement circle
around one center symbol or on several concentric circles.
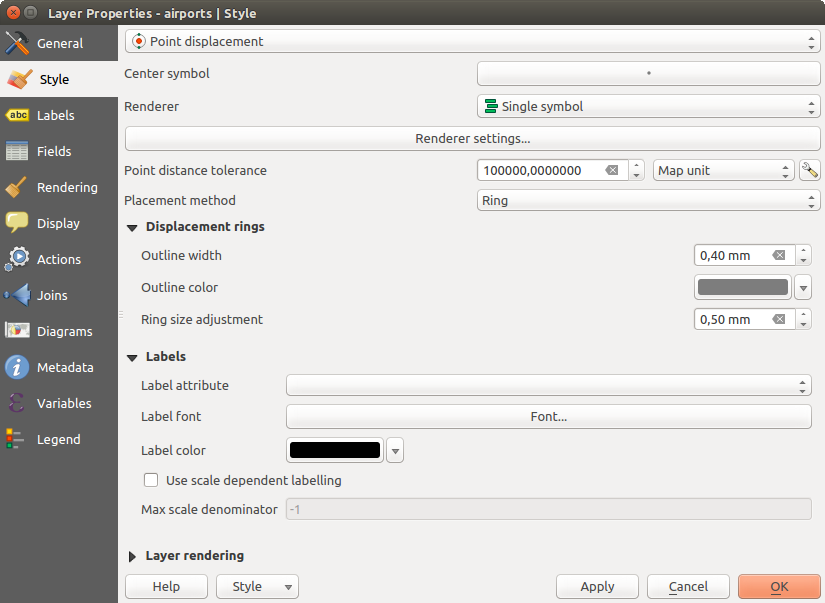
Fenêtre Déplacement de points
Note
You can still render features with other renderer like Single symbol, Graduated, Categorized or Rule-Based renderer using the Renderer drop-down list then the Renderer Settings... button.
Inverted Polygon Renderer
Le rendu en  Polygones inversés permet de définir un symbole à appliquer à l’extérieur des polygones de la couche. Comme précédemment, vous pouvez alors choisir parmi des sous-modes de rendu : Symbole unique, Gradué, Catégorisé, Ensemble de règles ou 2.5 D.
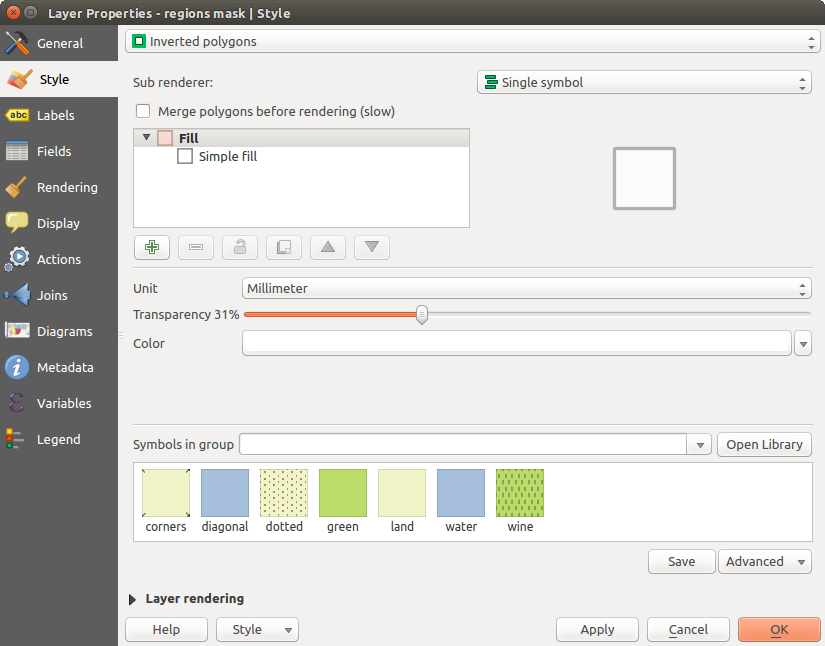
Fenêtre du mode de rendu en Polygones Inversés
Heatmap Renderer
With the  Heatmap renderer you can create live
dynamic heatmaps for (multi)point layers.
You can specify the heatmap radius in pixels, mm or map units, choose and
edit a color ramp for the heatmap style and use a slider for selecting a trade-off
between render speed and quality. You can also define a maximum value limit and give a
weight to points using a field or an expression. When adding or removing a feature
the heatmap renderer updates the heatmap style automatically.
Heatmap renderer you can create live
dynamic heatmaps for (multi)point layers.
You can specify the heatmap radius in pixels, mm or map units, choose and
edit a color ramp for the heatmap style and use a slider for selecting a trade-off
between render speed and quality. You can also define a maximum value limit and give a
weight to points using a field or an expression. When adding or removing a feature
the heatmap renderer updates the heatmap style automatically.
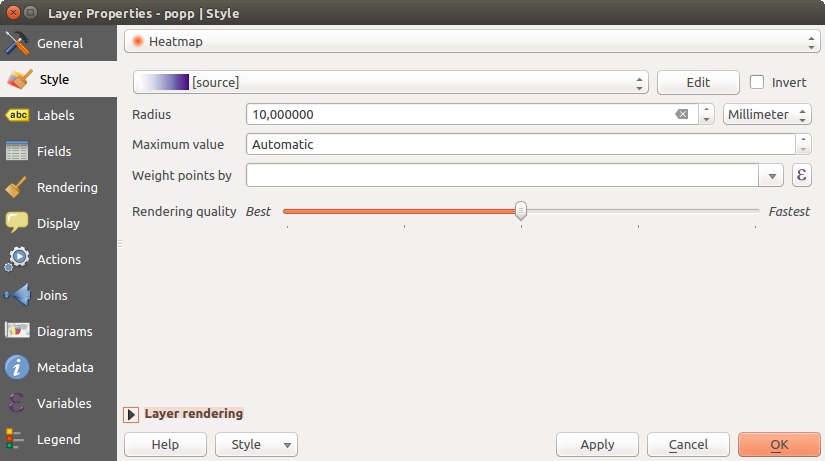
Fenêtre Carte de chaleur
2.5D Renderer
L’utilisation du rendu  2.5D permet de créer un effet 2.5D sur les entités de votre couche. Commencez par choisir une valeur de Hauteur (en unités cartographiques). Vous pouvez utiliser une valeur fixe, l’un des champs de votre calque ou une expression. Vous devez également choisir un Angle (en degrés) pour recréer la position du spectateur (0° à l’ouest, sens croissant dans le sens inverse des aiguilles d’une montre). Utilisez les options de configuration avancées pour définir la Couleur du toît et la Couleur de mur. Si vous souhaitez simuler le rayonnement solaire sur les entités de murs, cocher la case
  Ombrager les murs en se basant sur leur aspect. Vous pouvez également simuler une ombre en définissant une Couleur et une Taille (en unités cartographiques).
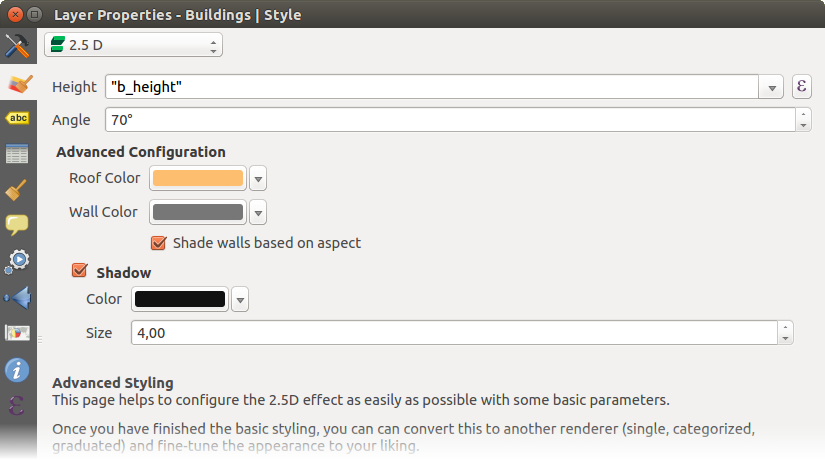
Fenêtre 2.5D
Astuce
Utilisation de l’effet 2.5D avec d’autres styles de rendu
Quand vous avez terminé de définir le style rendu 2.5D, vous pouvez le convertir en un autre rendu (symbole unique, catégorisé, gradué). Les effets 2.5D seront conservés et toutes les autres options spécifiques au rendu seront disponibles (de cette façon, vous pouvez par exemple catégoriser des symboles avec une belle représentation 2.5D ou ajouter un style complémentaire à vos symboles 2.5D). Pour vous assurer que l’ombre et le «bâtiment» lui-même n’interfèrent pas avec d’autres entités voisines, vous pouvez activer les niveaux de symboles (Avancé -> Niveaux de symbole...). Les valeurs de hauteur et d’angle du 2,5D sont enregistrées dans les variables de la couche, vous pouvez donc les éditer dans l’onglet variables de la fenêtre de propriétés de la couche.
Rendu de couche
From the Style tab, you can also set some options that invariabily act on all features of the layer:
Layer transparency
 : You can make the underlying layer in
the map canvas visible with this tool. Use the slider to adapt the visibility
of your vector layer to your needs. You can also make a precise definition of
the percentage of visibility in the the menu beside the slider.
: You can make the underlying layer in
the map canvas visible with this tool. Use the slider to adapt the visibility
of your vector layer to your needs. You can also make a precise definition of
the percentage of visibility in the the menu beside the slider.Layer blending mode and Feature blending mode: You can achieve special rendering effects with these tools that you may previously only know from graphics programs. The pixels of your overlaying and underlaying layers are mixed through the settings described in Modes de fusion.
Appliquer les effets sur les entités de la couche avec le bouton Effets.
Le Contrôle de l’ordre de rendu des couches vous permet de définir l’index z qui déterminera l’ordre de rendu des entités, à partir de leurs attributs. Activez la case à cocher et cliquez sur le bouton
 sur le côté. Vous obtiendrez une boîte de dialogue Définir l’ordre dans laquelle vous:
- choose a field or build an expression to apply to the layer features
- set in which order the fetched features should be sorted, i.e. if you choose Ascending order, the features with lower value are rendered under those with upper value.
- define when features returning NULL value should be rendered: first or last.
You can add several rules of ordering. The first rule is applied to all the features in the layer, z-ordering them according to the value returned. Then, for each group of features with the same value (including those with NULL value) and thus same z-level, the next rule is applied to sort its items among them. And so on...
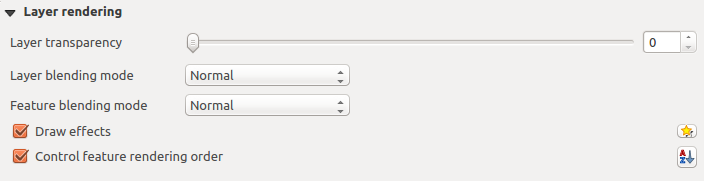
Options de rendu de couche
Autres Paramètres
Symbols levels
Pour les moteurs de rendu qui permettent l’empilement des couches de symbole (seul carte de chaleur ne le permet pas), il existe une option pour contrôler l’ordre de rendu de chaque niveau de symbole.
For most of the renderers, you can access the Symbols levels option by clicking the [Advanced] button below the saved symbols list and choosing Symbol levels. For the Rule-based Renderer the option is directly available through [Symbols levels] button, while for Point displacement Renderer renderer the same button is inside the Rendering settings dialog.
Pour activer les niveaux de symbole, sélectionnez Niveaux de symboles.... Chaque ligne représentera un exemple de symbole combiné avec son étiquette et la couche de symbole divisée en colonnes avec numéro dans chacune d’elles. Ces nombres représentent l’ordre de représentation de la couche. Les valeurs faibles sont dessinées en premier, en restant vers le bas alors que les valeurs les plus importantes sont dessinées plus tard, au dessus des autres.
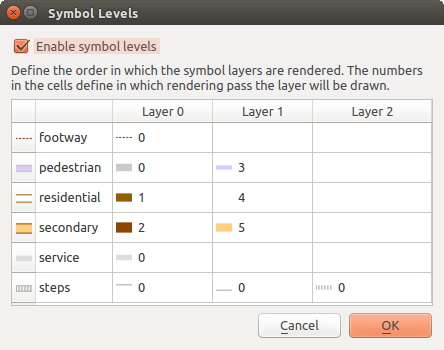
Fenêtre Niveaux de symbole
Note
Si les niveaux de symbole sont désactivés, les symboles complets seront dessinés en fonction de l’ordre des entités. Les symboles situés au dessus masqueront ceux situés en dessous. Des symboles de même niveau ne seront pas “fusionnés” ensemble.
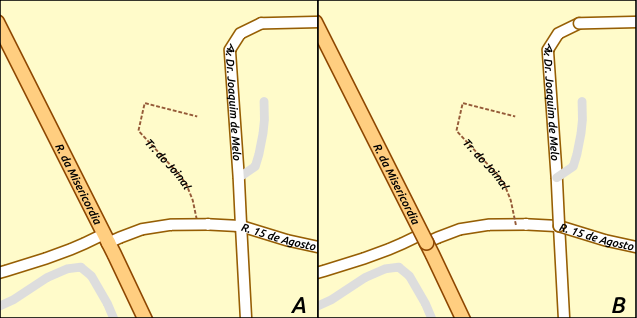
Différence de rendu selon que les niveaux de symboles sont activés (A) ou non (B)
Effets
Pour améliorer le rendu de la couche et éviter (ou au moins réduire) d’utiliser un autre logiciel pour l’édition finale des cartes, QGIS fournit une autre fonctionnalité puissante: les options d’ Effets qui ajoute des effets d’affichage afin de personnaliser la visualisation des couches vecteur.
The option is available in the Layer Properties –> Style dialog, under the Layer rendering group (applying to the whole layer) or in symbol layer properties (applying to corresponding features). You can combine both usage.
Paint effects can be activated by checking the Draw effects option
and clicking the Customize effects button, that will open
the Effect Properties Dialog (see figure_effects_source). The following
effect types, with custom options are available:
Source: Draws the feature’s original style according to the configuration of the layer’s properties. The transparency of its style can be adjusted.
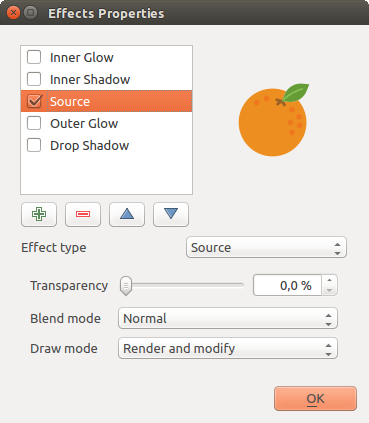
Effets: boîte de dialogue pour Source.
Blur: Adds a blur effect on the vector layer. The options that someone can change are the Blur type (Stack or Gaussian blur), the strength and transparency of the blur effect.
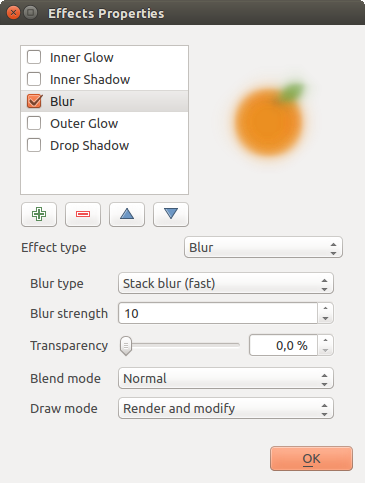
Effets: boîte de dialogue Flou.
Colorize: This effect can be used to make a version of the style using one single hue. The base will always be a grayscale version of the symbol and you can use the
 Grayscale to select how to create it
(options are: ‘lightness’, ‘luminosity’ and ‘average’). If
Colorise is selected, it will be possible to mix another color
and choose how strong it should be. You can also control the
Brightness, contrast and
saturation levels of the resulting symbol.
Grayscale to select how to create it
(options are: ‘lightness’, ‘luminosity’ and ‘average’). If
Colorise is selected, it will be possible to mix another color
and choose how strong it should be. You can also control the
Brightness, contrast and
saturation levels of the resulting symbol.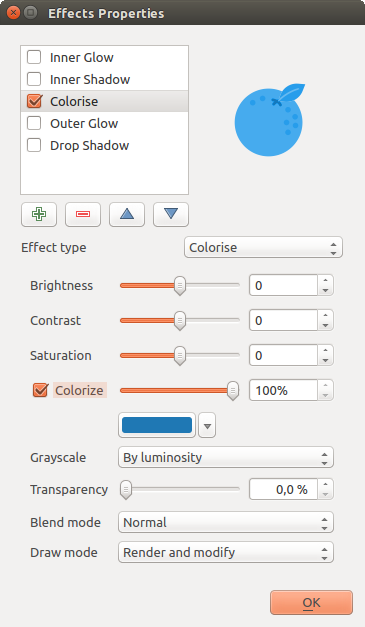
Effets: boîte de dialogue Coloriser.
Drop Shadow: Using this effect adds a shadow on the feature, which looks like adding an extra dimension. This effect can be customized by changing the offset degrees and radius, determining where the shadow shifts towards to and the proximity to the source object. Drop Shadow also has the option to change the blur radius, the transparency and the color of the effect.
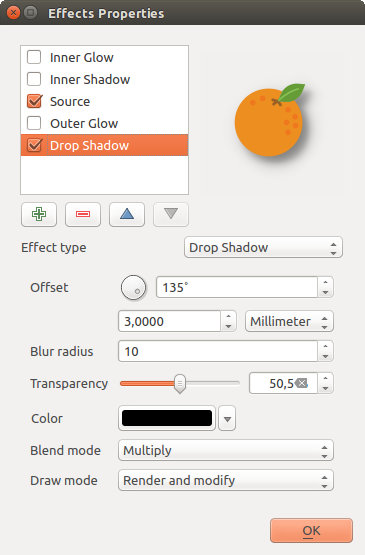
Effets: boîte de dialogue de l’ombre portée.
Inner Shadow: This effect is similar to the Drop Shadow effect, but it adds the shadow effect on the inside of the edges of the feature. The available options for customization are the same as the Drop Shadow effect.
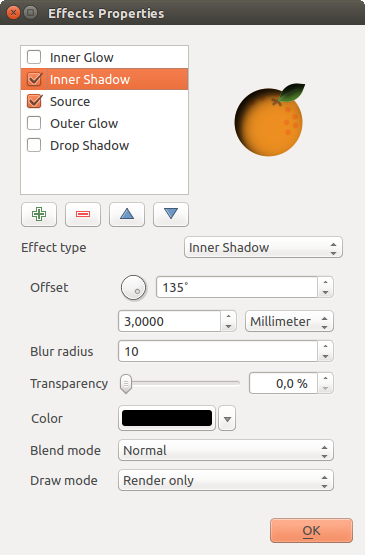
Effets: boîte de dialogue de l’ombre intérieure.
Inner Glow: Adds a glow effect inside the feature. This effect can be customized by adjusting the spread (width) of the glow, or the Blur radius. The latter specifies the proximity from the edge of the feature where you want any blurring to happen. Additionally, there are options to customize the color of the glow, with a single color or a color ramp.
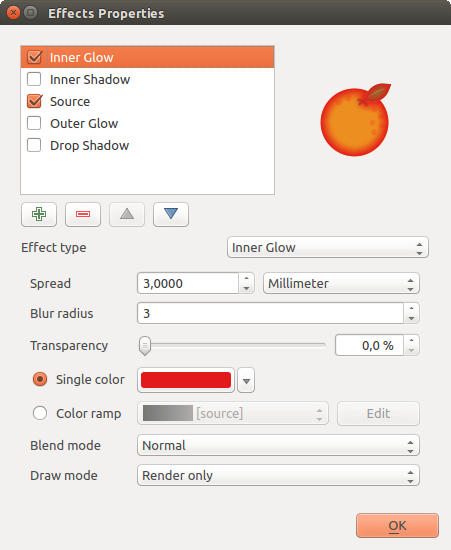
Effets: boîte de dialogue de luminescence interne.
Outer Glow: This effect is similar to the Inner Glow effect, but it adds the glow effect on the outside of the edges of the feature. The available options for customization are the same as the Inner Glow effect.
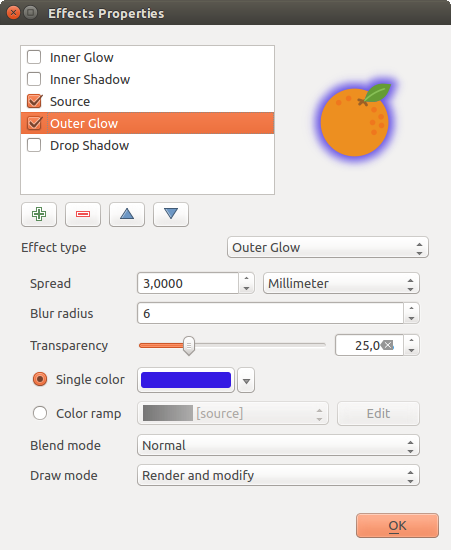
Effets: boîte de dialogue de luminescence externe.
Transform: Adds the possibility of transforming the shape of the symbol. The first options available for customization are the Reflect horizontal and Reflect vertical, which actually create a reflection on the horizontal and/or vertical axes. The 4 other options are:
- Shear: slants the feature along the x and/or y axis
- Scale: enlarges or minimizes the feature along the x and/or y axis by the given percentage
- Rotation: turns the feature around its center point
- and Translate changes the position of the item based on a distance given on the x and/or the y axis.
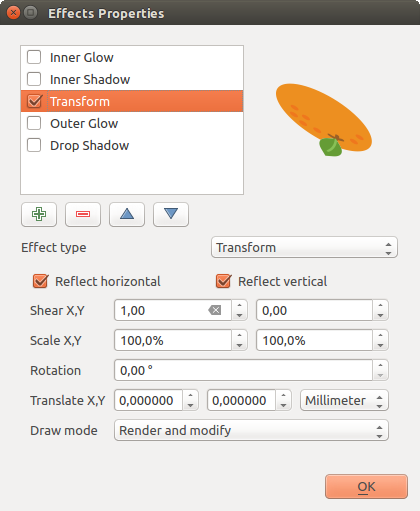
Effets: boîte de dialogue Transformer.
There are some common options available for all draw effect types. Transparency and Blend mode options work similar to the ones described in Rendu de couche and can be used in all draw effects except for the transform one.
One or more draw effects can used at the same time. You activate/deactivate an effect
using its checkbox in the effects list. You can change the selected effect type by
using the Effect type option. You can reorder the effects
using  Move up and
  Move down
buttons, and also add/remove effects using the
Move down
buttons, and also add/remove effects using the  Add effect
and
Add effect
and  Remove effect buttons.
There is also a Draw mode option available for
every draw effect, and you can choose whether to render and/or to modify the
symbol. Effects render from top to bottom.’Render only’ mode means that the
effect will be visible while the ‘Modify only’ mode means that the effect will
not be visible but the changes that it applies will be passed to the next effect
(the one immediately below). The ‘Render and Modify’ mode will make the
effect visible and pass any changes to the next effect. If the effect is in the
top of the effects list or if the immediately above effect is not in modify
mode, then it will use the original source symbol from the layers properties
(similar to source).
Propriétés d’Étiquetage
L’onglet  Étiquettes fournit tous les paramètres de configuration nécessaires pour créer des étiquettes intelligentes sur vos couches vectorielles. Cette fenêtre est également accessible depuis le panneau Layer Styling ou en cliquant sur le bouton Paramètres d’étiquetage de la couche de la Barre d’outils des Étiquettes.
Paramétrer une étiquette
The first step is to choose the labeling method from the drop-down list. There are four options available:
- No labels
- Show labels for this layer
- Rule-based labeling
- and Blocking: allows to set a layer as just an obstacle for other layer’s labels without rendering any labels of its own.
The next steps assume you select the Show labels for this layer option, enabling following tabs that help you configure the labeling:
It also enables the Label with drop-down list, from which you can select an
attribute column to use. Click if you want to define
labels based on expressions - See Définir des étiquettes basées sur des expressions.
Les étapes présentées ci-dessous décrivent un étiquetage simple, sans utilisation des fonctions de Valeurs définies par les données, situées à droite des paramètres à définir. Voir Utiliser des valeurs de paramètres définies par les données pour l’étiquetage pour un cas d’utilisation.
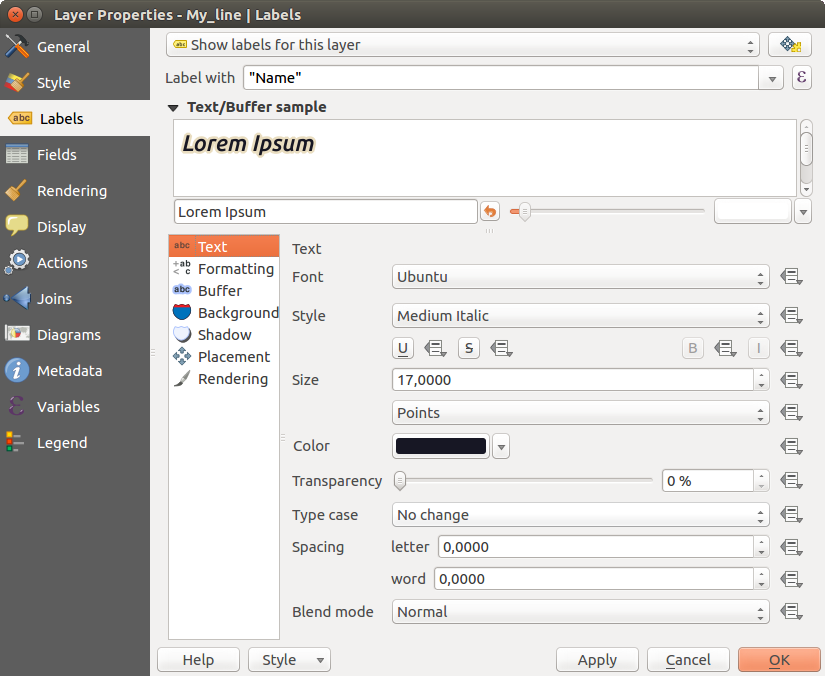
Paramètres d’étiquetage de la couche - Onglet texte
Onglet Texte
In the Text tab, you can define the Font, Style, and Size of your labels’ text (see Figure_labels). There are options available to set the labels’ Color and Transparency. Use the Type case option to change the capitalization style of the text. You have the possibility to render the text as ‘All uppercase’, ‘All lowercase’ or ‘Capitalize first letter’. In Spacing, you can change the space between words and between individual letters. Finally, use the Blend mode option to determine how your labels will mix with the map features below them (see more about it in Modes de fusion).
The Apply label text substitutes option gives you ability to specify a list of texts to substitute to texts in feature labels (e.g., abbreviating street types). Replacement texts are thus used to display labels in the map canvas. Users can also export and import lists of substitutes to make reuse and sharing easier.
Onglet Formatage
In the Formatting tab, you can define a character for a line break in the labels with the Wrap on character option. You can also format the Line Height and the alignment. For the latter, typical values are available (left, right, and center), plus Follow label placement for point layers. When set to this mode, text alignment for labels will be dependent on the final placement of the label relative to the point. E.g., if the label is placed to the left of the point, then the label will be right aligned, while if it is placed to the right, it will be left aligned.
For line vector layers you can include Line directions symbols to help determine the lines directions. They work particularly well when used with the curved or Parallel placement options from the Placement tab. There are options to set the symbols position, and to reverse direction.
Use the Formatted numbers option to format numeric
labels. You can set the number of Decimal places. By default, 3
decimal places will be used. Use the Show plus sign if
you want to show the plus sign in positive numbers.
Onglet Tampon
To create a buffer around the labels, activate the
Draw text buffer checkbox in the Buffer tab. You can
set the buffer’s Size, color, and
Transparency. The buffer expands from the label’s outline
, so, if the color buffer’s fill checkbox is
activated, the buffer interior is filled. This may be relevant when
using partially transparent labels or with non-normal blending
modes, which will allow seeing behind the label’s text. Deactivating
color buffer’s fill checkbox (while using totally
transparent labels) will allow you to create outlined text labels.
Onglet Fond
In the Background tab, you can define with Size X and Size Y the shape of your background. Use Size type to insert an additional ‘Buffer’ into your background. The buffer size is set by default here. The background then consists of the buffer plus the background in Size X and Size Y. You can set a Rotation where you can choose between ‘Sync with label’, ‘Offset of label’ and ‘Fixed’. Using ‘Offset of label’ and ‘Fixed’, you can rotate the background. Define an Offset X,Y with X and Y values, and the background will be shifted. When applying Radius X,Y, the background gets rounded corners. Again, it is possible to mix the background with the underlying layers in the map canvas using the Blend mode (see Modes de fusion).
Onglet Ombre
Use the Shadow tab for a user-defined Drop shadow.
The drawing of the background is very variable.
Choose between ‘Lowest label component’, ‘Text’, ‘Buffer’ and ‘Background’.
The Offset angle depends on the orientation
of the label. If you choose the Use global shadow checkbox,
then the zero point of the angle is
always oriented to the north and doesn’t depend on the orientation of the label.
You can influence the appearance of the shadow with the Blur radius.
The higher the number, the softer the shadows. The appearance of the drop shadow
can also be altered by choosing a blend mode.
Onglet Emplacement
Choose the Placement tab for configuring label placement and labeling priority. Note that the placement options differ according to the type of vector layer, namely point, line or polygon.
Emplacement pour les couches de points
With the  Cartographic placement mode,
point labels are generated with a better visual relationship with the
point feature, following ideal cartographic placement rules. Labels can be
placed at a set Distance either from the point feature itself
or from the bounds of the symbol used to represent the feature.
The latter option is especially useful when the symbol size isn’t fixed,
e.g. if it’s set by a data defined size or when using different symbols
in a categorized renderer.
Cartographic placement mode,
point labels are generated with a better visual relationship with the
point feature, following ideal cartographic placement rules. Labels can be
placed at a set Distance either from the point feature itself
or from the bounds of the symbol used to represent the feature.
The latter option is especially useful when the symbol size isn’t fixed,
e.g. if it’s set by a data defined size or when using different symbols
in a categorized renderer.
Par défaut, les placements sont priorisés selon l’ordre suivant:
en haut à droite
en haut à gauche
coin inférieur droit
coin inférieur gauche
au centre à droite
au centre à gauche
en haut, décalé légèrement à droite
en bas, décalé légèrement à gauche.
La priorité de placement peut cependant être paramétrée pour une entité donnée en utilisant une liste des priorités définie par les données. Cela ne permet d’utiliser que certains emplacements, par exemple : pour les entités représentant la côte, vous pouvez empêcher les étiquettes de s’afficher sur les terres.
Le paramètre Autour du point place l’étiquette dans un cercle de rayon fixe (défini dans Distance) autour de l’entité. Le placement de l’étiquette peut également être contraint en utilisant l’option Quadrant.
Avec l’option Décalage par rapport au point, les étiquettes sont placées à une distance fixe du point de l’entité. Vous pouvez sélectionner le Quadrant dans lequel sera placée l’étiquette. Vous pouvez également paramétrer les distances X et Y entre les points et leurs étiquettes ainsi que l’angle de l’étiquette avec le paramètre Rotation. Ainsi, l’étiquette sera placée dans le quadrant sélectionné avec une rotation définie.
Emplacement pour les couches de lignes
Label options for line layers include Parallel,
 Curved or Horizontal.
For the Parallel and
Curved options, you can set the position to
Above line, On line and
Below line. It’s possible to select several options at once. In
that case, QGIS will look for the optimal label position. For Parallel and
curved placement options, you can also use the line orientation for the
position of the label. Additionally, you can define a Maximum
angle between curved characters when selecting the
Curved option (see Figure_labels_placement_line).
Curved or Horizontal.
For the Parallel and
Curved options, you can set the position to
Above line, On line and
Below line. It’s possible to select several options at once. In
that case, QGIS will look for the optimal label position. For Parallel and
curved placement options, you can also use the line orientation for the
position of the label. Additionally, you can define a Maximum
angle between curved characters when selecting the
Curved option (see Figure_labels_placement_line).
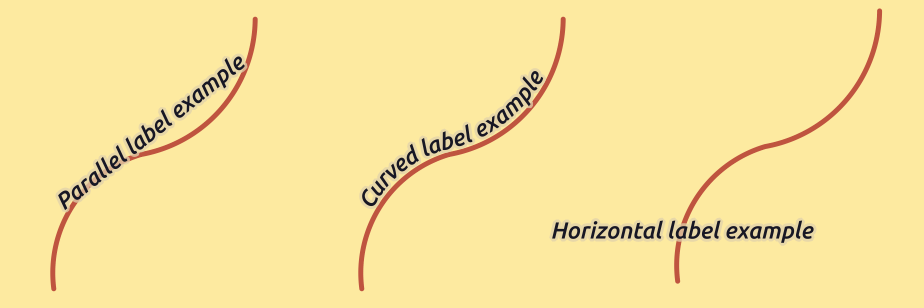
Exemples d’emplacements d’étiquettes pour une ligne
Pour les trois options d’emplacement, vous pouvez Répéter les étiquettes en spécifiant une distance minimale entre les étiquettes. Cette distance peut être en millimètres ou en Unités de la carte.
Emplacement pour les couches de polygones
Vous pouvez choisir parmi les options suivantes pour l’emplacement des étiquettes sur une couche de polygones (voir figure_labels_placement_polygon) :
- Décalé par rapport au centroide,
- Horizontal (lent),
- Autour du centroïde,
- Libre (lent),
- Selon le périmètre,
- Selon le périmètre (incurvé).
In the Offset from centroid settings you can
specify if the centroid is of the visible
polygon or whole polygon. That means that
either the centroid is used for the polygon you can see on the map or the
centroid is determined for the whole polygon, no matter if you can see the
whole feature on the map. You can place your label within a specific
quadrant, and define offset and rotation.
The Around centroid setting places the label at a specified
distance around the centroid. Again, you can define
visible polygon or whole polygon
for the centroid.
With the Horizontal (slow) or Free (slow) options, QGIS places at the best position either a horizontal or a rotated label inside the polygon.
With the Using perimeter option, the label
will be drawn next to the polygon boundary. The label will behave like the
parallel option for lines. You can define a position and a distance for the
label. For the position, Above line,
On line, Below line and
Line orientation dependent position are possible. You can
specify the distance between the label and the polygon outline, as well as
the repeat interval for the label.
The Using perimeter (curved) option helps you draw the label along the polygon boundary, using a curved labeling. In addition to the parameters available with Using perimeter setting, you can set the Maximum angle between curved characters polygon, either inside or outside.
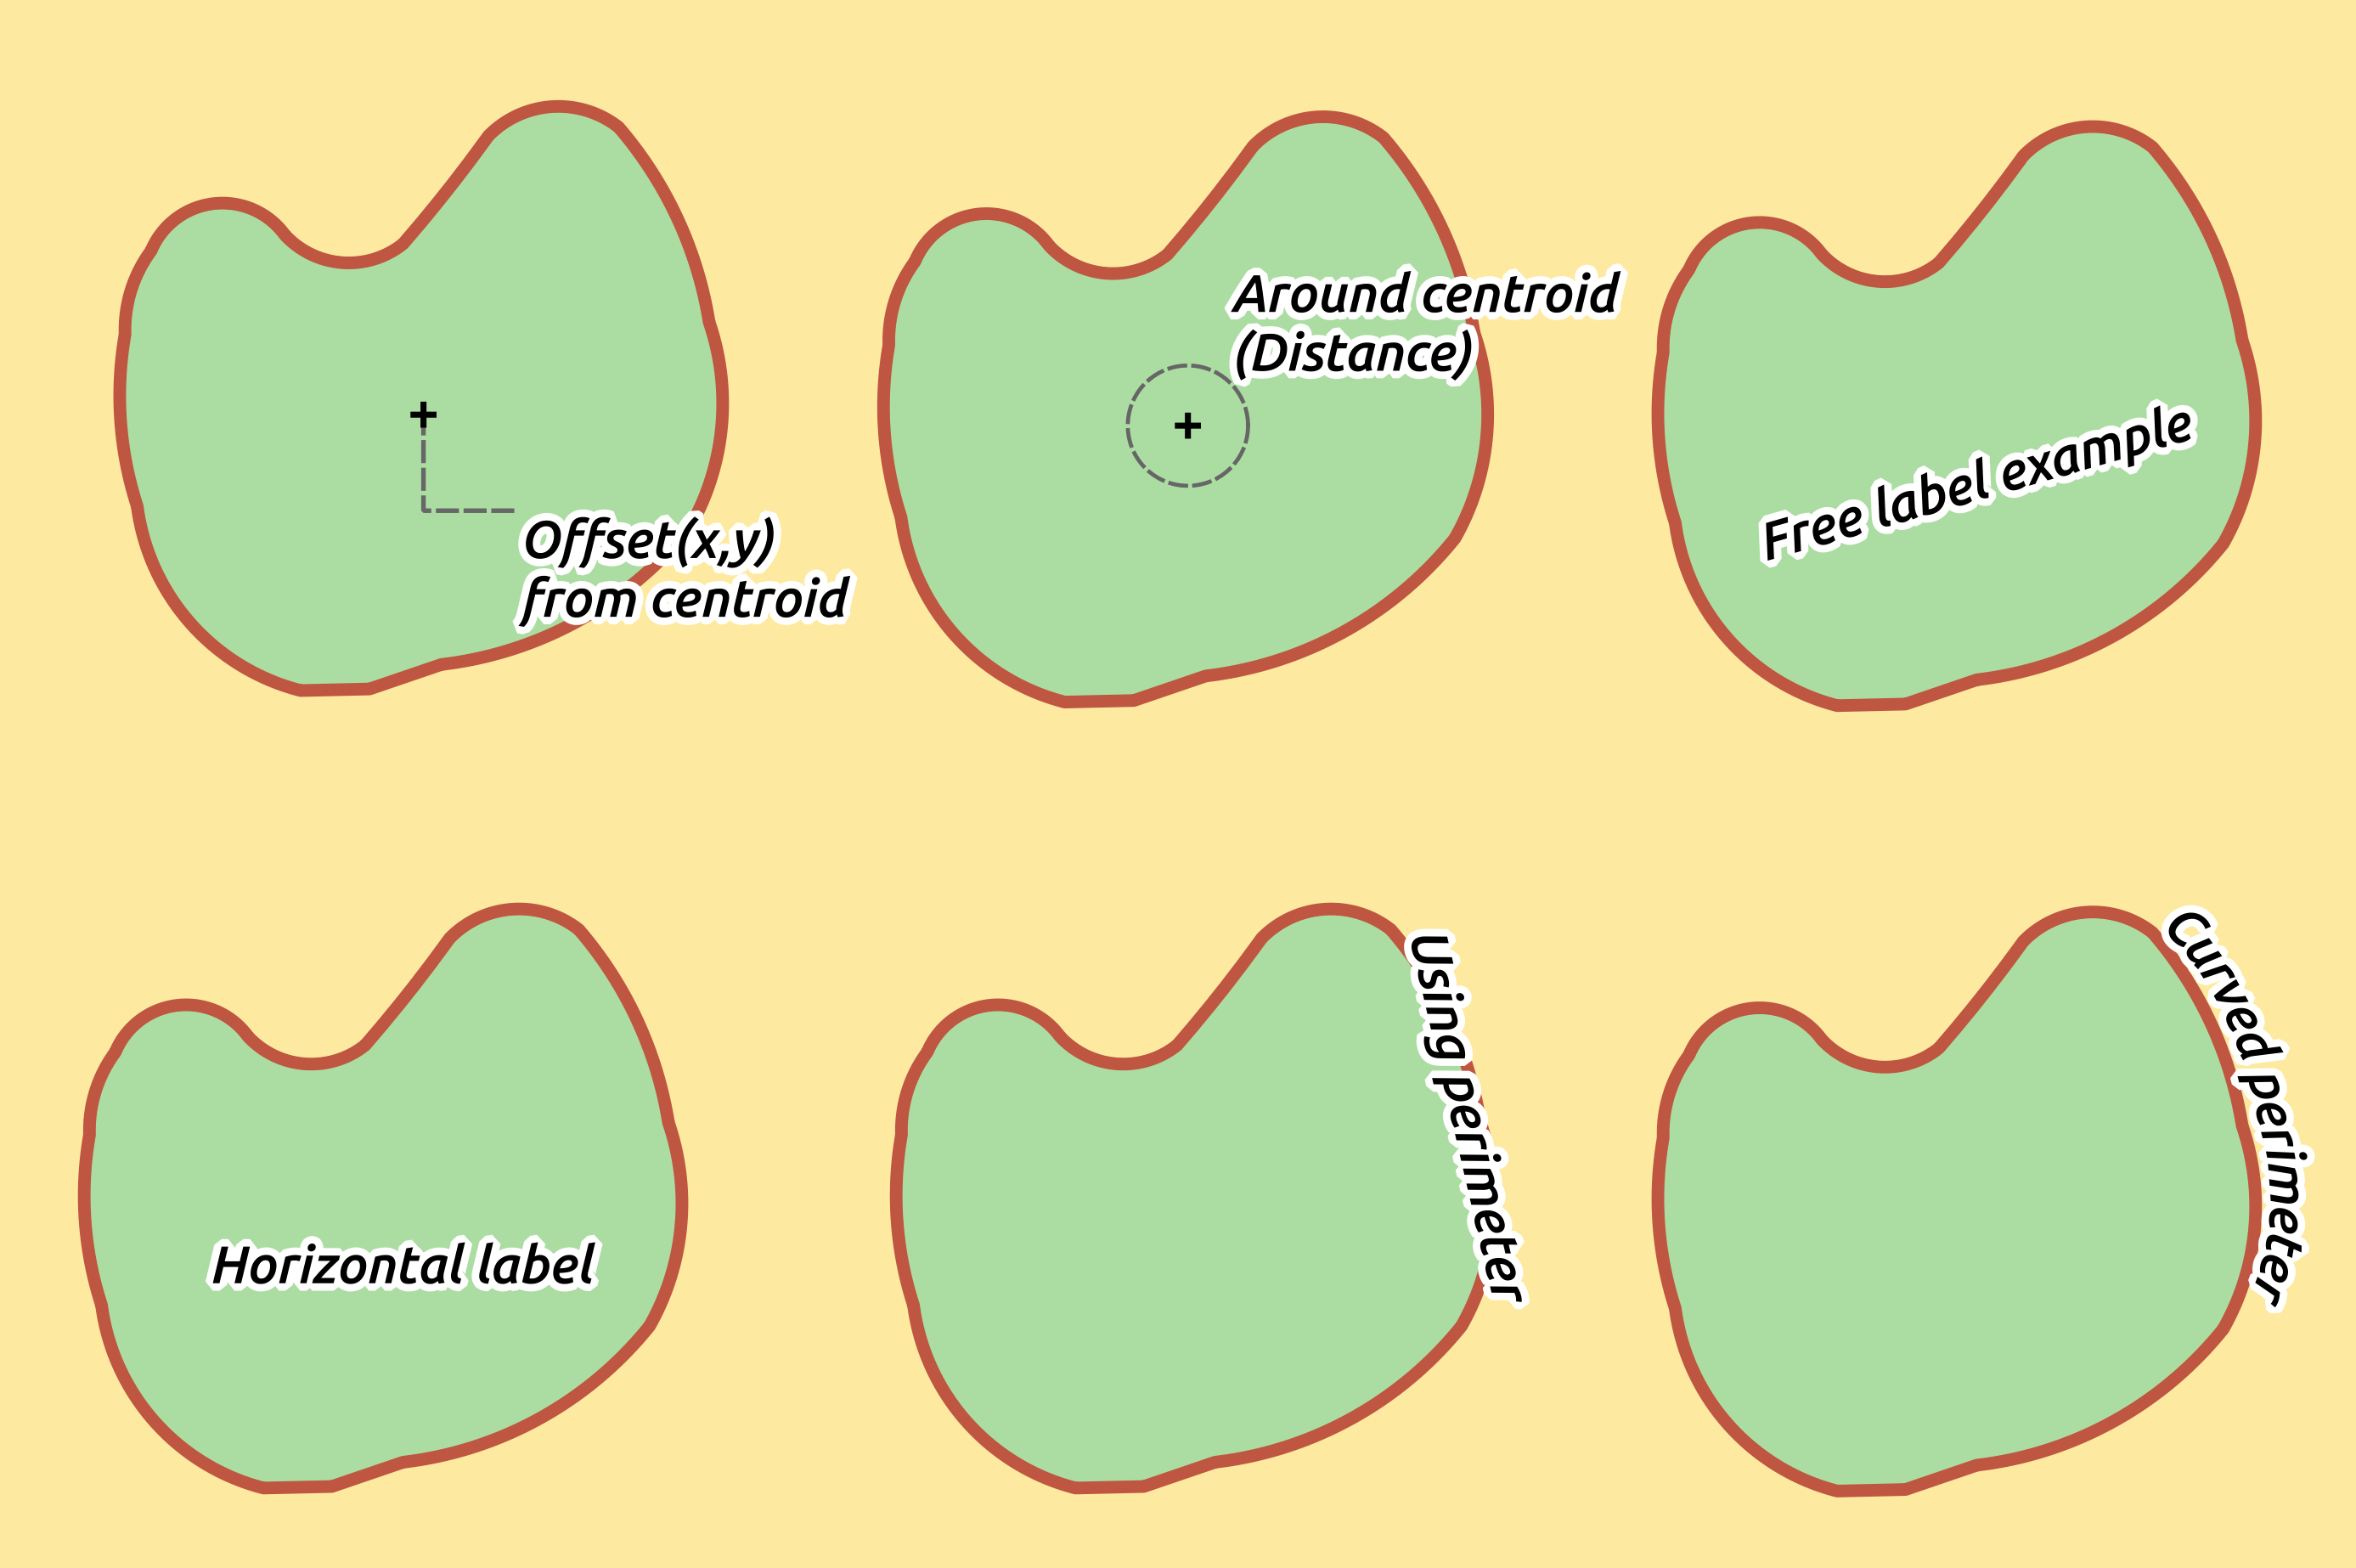
Exemples d’emplacements d’étiquettes pour un polygone
In the priority section you can define the priority with which labels are rendered for all three vector layer types (point, line, polygon). This placement option interacts with the labels from other vector layers in the map canvas. If there are labels from different layers in the same location, the label with the higher priority will be displayed and the others will be left out.
Onglet Rendu
In the Rendering tab, you can tune when the labels can be rendered and their interaction with other labels and features.
Sous les Options des étiquettes, vous trouverez les paramètres de ref:visibilité selon l’échelle <label_scaledepend> et de visibilité basée sur la taille des pixels.
L’index z des étiquettes détermine l’ordre dans lequel les étiquettes sont générées ainsi que la relation avec les autres étiquettes dans la couche (en utilisant une expression basée sur des données) et avec les étiquettes des autres couches. Les étiquettes avec un index z élevé sont affichées au dessus des étiquettes (de n’importe qu’elle autre couche) avec une valeur d’index plus faible.
De plus, la logique a été affinée pour gérer les cas où 2 étiquettes ont un index z identique :
Si elles sont dans la même couche, une étiquette plus petite sera toujours tracée au dessus de l’étiquette plus large.
Si elles sont issues de couches différentes, les étiquettes sont tracées dans le même ordre que les couches (pour respecter l’ordre des couches dans la légende).
À noter que ce paramètre ne définit par comment sont tracées les étiquettes par rapport aux entités d’autres couches, il contrôle uniquement l’ordre dans lequel les étiquettes sont tracées au dessus des entités de la couche.
Lors de la génération des étiquettes et pour pouvoir afficher des étiquettes lisibles, QGIS évalue automatiquement la position des étiquettes et peut masquer certaines d’entre elles en cas de collision. Vous pouvez néanmoins choisir d’ Afficher toutes les étiquettes pour cette couche (même celles en conflit) pour pouvoir gérer manuellement leur placement.
Vous pouvez affiner quelles étiquettes seront générées en utilisant des expressions de valeurs définies par les données pour les options guilabel:Afficher l’étiquette et Toujours afficher.
Sous les Options des entités, vous pouvez choisir d’Étiqueter toutes les parties d’une entité multi-parties et vous pouvez paramétrer une de Limite du nombre d’étiquettes à afficher. Les couches de polygones et de lignes permettent d’indiquer une taille minimum d’entité pour afficher les étiquettes en utilisant Ne pas afficher d’étiquette pour les entités plus petites que. Pour les entités polygones, vous pouvez également filtrer les étiquettes à afficher selon qu’elles sont situées complètement dans l’entité ou non. Pour les entités linéaires, vous pouvez choisir de Fusionner les lignes connectées pour éviter la duplication d’étiquettes, ce qui permettra un rendu plus aéré, lorsque conjugué avec les options Distance ou Répéter de l’onglet Emplacement.
Dans la groupe Obstacles, vous pouvez gérer la manière dont les étiquettes et les entités se recouvrent. Activez l’option Éviter que les étiquettes ne recouvrent des entités pour faire en sorte que les entités de la couche agissent comme obstacle pour toute étiquette (en incluant les étiquettes des autres entités de la même couche). Un obstacle est une entité au dessus de laquelle QGIS essaye, dans la mesure du possible, de ne pas placer d’étiquette. Au lieu d’une couche tout entière, vous pouvez définir un sous-ensemble d’entités comme obstacle en utilisant le contrôle de valeurs définies par les données sur le côté de l’option.
La jauge de priorité des obstacles vous permet de modifier les préférences de recouvrement de vos étiquettes par rapport aux entités de certaines couches plutôt qu’à d’autres. Un obstacle de Poids faible signifie que les entités de la couche sont moins considérées comme des obstacles et ont plus de chances d’être recouvertes par des étiquettes. Cette priorité peut être définie par des données de telle manière qu’au sein de la même couche, certaines entités auront plus de chances d’être recouvertes que d’autres.
Pour les couches de polygones, vous pouvez choisir le type d’obstacle que les étiquettes chercheront à éviter :
Au-dessus de l’entité : évite de placer les étiquettes à l’intérieur du polygone (les étiquettes seront placées de préférence totalement en dehors ou légèrement à l’intérieur du polygone).
Au-dessus des limites de l’entité : évite de placer les étiquettes sur la limite du polygone (les étiquettes seront placées de préférence en dehors ou complètement à l’intérieur du polygone). Cela peut être utile pour les limites de régions où les entités recouvrent complètement une surface. Dans ce cas, il est impossible d’éviter de placer des étiquettes à l’intérieur de ces entités et l’affichage sera meilleur si on évite de placer les étiquettes sur les limites entre les entités.
Étiquettes basées sur des règles
With rule-based labeling multiple label configurations can be defined and applied selectively on the base of expression filters and scale range, as in Rule-based rendering.
To create a rule, select the Rule-based labeling option in the main
drop-down list from the Labels tab and click the button
at the bottom of the dialog. Then fill the new dialog with a description and an
expression to filter features. You can also set a scale range in which the label rule should be applied. The other
options available in this dialog are the common settings
seen beforehand.
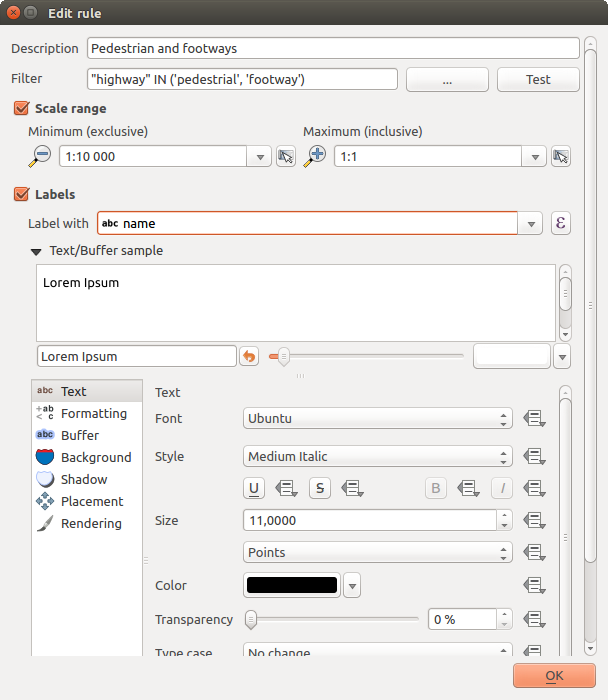
Paramètres des règles
A summary of existing rules is shown in the main dialog (see figure_labels_rule_based).
You can add multiple rules, reorder or imbricate them with a drag-and-drop.
You can as well remove them with the button or edit them with
 button or a double-click.
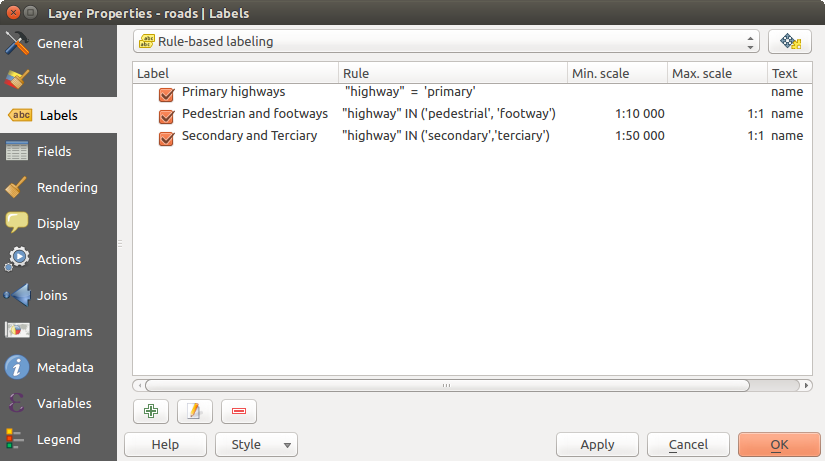
Étiquetage basé sur des règles
Définir des étiquettes basées sur des expressions
Whether you choose simple or rule-based labeling type, QGIS allows using
expressions to label features. Click the icon near the
Label with drop-down list in the Labels tab
of the properties dialog. In figure_labels_expression, you see a sample
expression to label the alaska regions with name and area size, based on the
field ‘NAME_2’, some descriptive text, and the function $area in combination
with format_number() to make it look nicer.
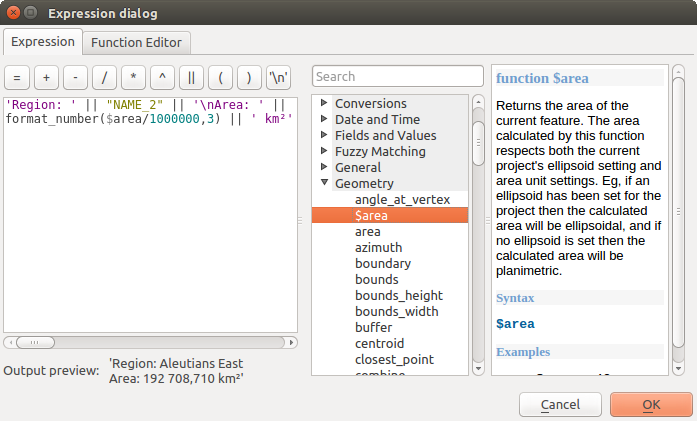
Utiliser des expressions pour l’étiquetage
Les Étiquettes basées sur des expressions sont faciles à utiliser. vous devez simplement faire attention aux points suivants :
- You need to combine all elements (strings, fields, and functions) with a string concatenation function such as concat, + or ||. Be aware that in some situations (when null or numeric value are involved) not all of these tools will fit your need.
Les chaînes de caractères doivent être écrites en utilisant des ‘guillemets simples’.
Les champs doivent être écrits avec des “guillemets doubles” ou sans guillemets.
Examinons quelques exemples :
Label based on two fields ‘name’ and ‘place’ with a comma as separator:
"name" || ', ' || "place"
Renvoie
John Smith, Paris
Label based on two fields ‘name’ and ‘place’ with other texts:
'My name is ' + "name" + 'and I live in ' + "place"
'My name is ' || "name" || 'and I live in ' || "place"
concat('My name is ', name, ' and I live in ', "place")
Renvoie
My name is John Smith and I live in Paris
Label based on two fields ‘name’ and ‘place’ with other texts combining different concatenation functions:
concat('My name is ', name, ' and I live in ' || place)Renvoie
My name is John Smith and I live in Paris
Or, if the field ‘place’ is NULL, returns:
My name is John Smith
Multi-line label based on two fields ‘name’ and ‘place’ with a descriptive text:
concat('My name is ', "name", '\n' , 'I live in ' , "place")Renvoie
My name is John Smith
I live in Paris
Label based on a field and the $area function to show the place’s name and its rounded area size in a converted unit:
'The area of ' || "place" || ' has a size of '
|| round($area/10000) || ' ha'
Renvoie
The area of Paris has a size of 10500 ha
Create a CASE ELSE condition. If the population value in field population is <= 50000 it is a town, otherwise it is a city:
concat('This place is a ',
CASE WHEN "population <= 50000" THEN 'town' ELSE 'city' END)
Renvoie
This place is a town
Comme vous pouvez le constater dans le constructeur d’expressions, vous avez à votre disposition une centaine de fonctions pour créer des expressions simples ou très complexes afin d’étiqueter vos données avec QGIS. Voir Expressions pour plus d’informations et des exemples d’expressions.
Utiliser des valeurs de paramètres définies par les données pour l’étiquetage
With the Data defined override functions, the settings for
the labeling are overridden by entries in the attribute table. It can be used to
set values for most of the labeling options described above. See the widget’s
description and manipulation in Valeurs définies par des données section.
La barre d’outils des Étiquettes
The Label Toolbar provides some tools to manipulate
label or  diagram
properties, but only if the corresponding data-defined option is indicated
(otherwise, buttons are disabled). Layer might also need to be in edit mode.
diagram
properties, but only if the corresponding data-defined option is indicated
(otherwise, buttons are disabled). Layer might also need to be in edit mode.
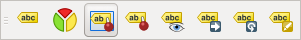
La barre d’outils des Étiquettes
While for readability, label has been used below to describe the Label toolbar, note that when mentioned in their name, the tools work almost the same way with diagrams:
 Pin/Unpin Labels And Diagrams that has data-defined
position. By clicking or draging an area, you pin label(s). If you click or
drag an area holding Shift, label(s) are unpinned. Finally, you can
also click or drag an area holding Ctrl to toggle the pin status of
label(s).
Pin/Unpin Labels And Diagrams that has data-defined
position. By clicking or draging an area, you pin label(s). If you click or
drag an area holding Shift, label(s) are unpinned. Finally, you can
also click or drag an area holding Ctrl to toggle the pin status of
label(s). Highlight Pinned Labels And Diagrams. If the
vector layer of the label is editable, then the highlighting is green,
otherwise it’s blue.
Highlight Pinned Labels And Diagrams. If the
vector layer of the label is editable, then the highlighting is green,
otherwise it’s blue. Move Label And Diagram that has data-defined
position. You just have to drag the label to the desired place.
Move Label And Diagram that has data-defined
position. You just have to drag the label to the desired place. Show/Hide Labels And Diagrams that has
data-defined visbility. If you click or drag an area holding Shift,
then label(s) are hidden. When a label is hidden, you just have to click
or drag an area around the feature’s point to restore its visibility.
Show/Hide Labels And Diagrams that has
data-defined visbility. If you click or drag an area holding Shift,
then label(s) are hidden. When a label is hidden, you just have to click
or drag an area around the feature’s point to restore its visibility. Rotate Label. Click the label and move around and
you get the text rotated.
Rotate Label. Click the label and move around and
you get the text rotated. Change Label. It opens a dialog to change the
clicked label properties; it can be the label itself, its coordinates, angle,
font, size... as long as this property has been mapped to a field.
Change Label. It opens a dialog to change the
clicked label properties; it can be the label itself, its coordinates, angle,
font, size... as long as this property has been mapped to a field.
Warning
Label tools overwrite current field values
Using the Label toolbar to customize the labeling actually writes the new value of the property in the mapped field. Hence, be careful to not inadvertently replace data you may need later!
Customize the labels from the map canvas
Combined with the Label Toolbar, the data defined override setting
helps you manipulate labels in the map canvas (move, edit, rotate).
We now describe an example using the data-defined override function for the
Move label function (see figure_labels_data_defined).
Importez la couche lakes.shp depuis le jeu de données test de QGIS.
Double-cliquez la couche pour ouvrir la fenêtre des Propriétés. Sélectionnez Etiquettes puis Emplacement et enfin
Décalage par rapport au centroïde.Dans le cadre Défini par les données, cliquez sur l’icône
pour définir le champ correspondant à la coordonnée. Choisissez xlabel pour X et ylabel pour Y. Les icônes revêtent maintenant une surbrillance jaune.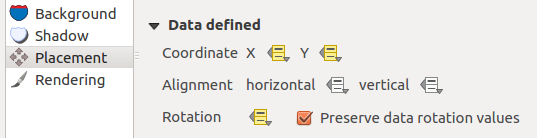
Étiquetage d’une couche vectorielle de polygones avec l’option ‘Défini par les données’
Zoomez sur un lac.
Set editable the layer using the
 Toggle Editing button.
Sélectionnez l’outil
de la barre d’outils des Étiquettes. Vous pouvez maintenant déplacer l’étiquette manuellement vers une autre position (voir figure_labels_move). La nouvelle position est sauvegardée dans les colonnes xlabel et ylabel de votre table attributaire.Using The Geometry Generator with the expression below, you can also add a linestring symbol layer to connect each lake to its moved label:
make_line( centroid( $geometry ), make_point( "xlabel", "ylabel" ) )
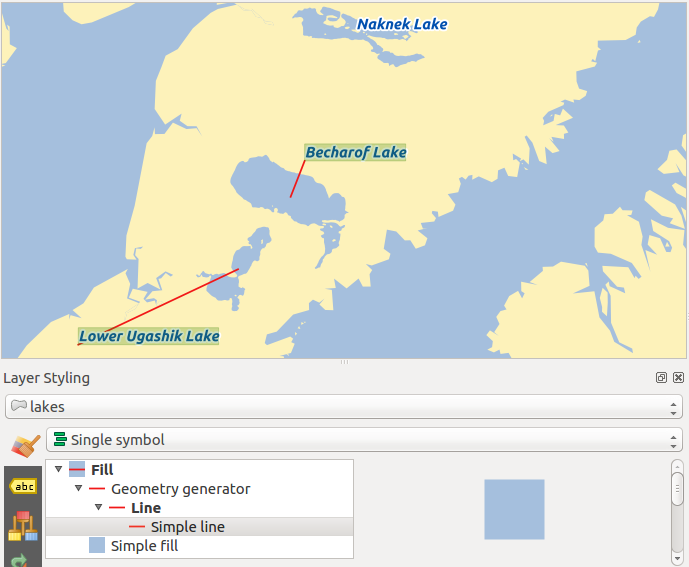
Moved labels
Fields Properties
 The Fields tab helps you organize the fields of
the selected dataset and the way you can interact with
the feature’s attributes. The buttons
The Fields tab helps you organize the fields of
the selected dataset and the way you can interact with
the feature’s attributes. The buttons  New field and
  Delete field
can be used when the dataset is in Editing mode.
Delete field
can be used when the dataset is in Editing mode.
You can rename fields by double-clicking in the fields name (note that you should switch to editing mode to edit the field name). This is only supported for data providers like PostgreSQL, Oracle, Memory layer and some OGR layer depending the OGR data format and version.
You can define some alias to display human readable fields in the feature form or the attribute table. In this case, you don’t need to switch to editing mode. Alias are saved in project file.
Comments can be added by clicking in the comment field of the column but if you are using a PostgreSQL layer, comment of the column could be the one in the PostgreSQL table if set. Comments are saved in the QGIS project file as for the alias.
The dialog also lists read-only characteristics of the field such as its type, type name, length and precision. When serving the layer as WMS or WFS, you can also check here which fields could be retrieved.
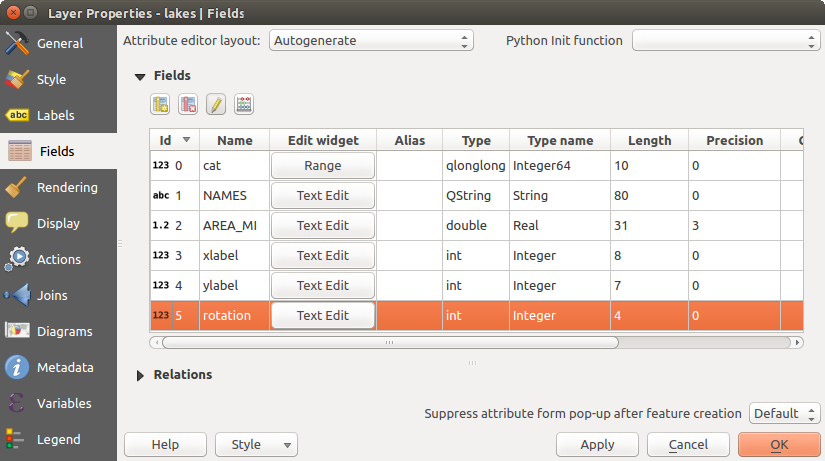
Field properties tab
Configure the field behavior
Within the Fields tab, you also find an Edit widget column. This column can be used to define values or a range of values that are allowed to be added to the specific attribute table column. It also helps to set the type of widget used to fill or display values of the field, in the attribute table or the feature form. If you click on the [Edit widget] button, a dialog opens, where you can define different widgets.
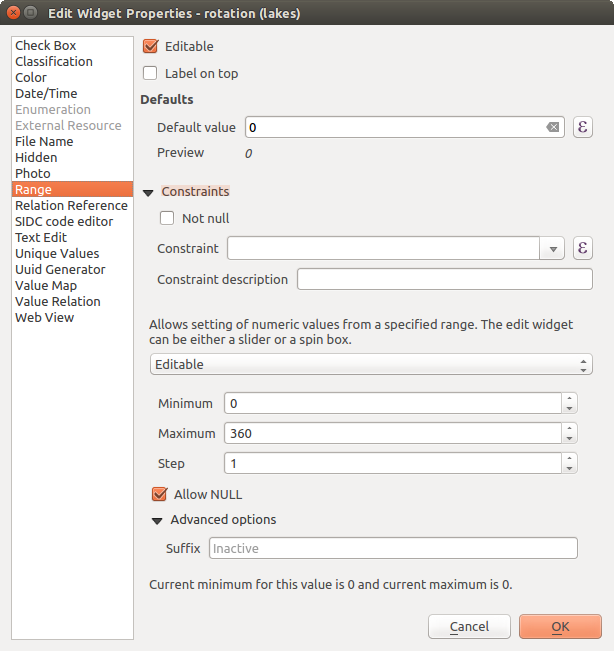
Fenêtre d’édition d’une colonne attributaire
Paramètres généraux
Regardless the type of widget applied to the field, there are some common properties you can set to control whether and how a field can be edited:
Editable: uncheck this to set the field read-only (not manually modifiable) when the layer is in edit mode. Note that checking this setting doesn’t override any edit limitation from the provider.
Label on top: places the field name above or beside the widget in the feature form
Default value: for new features, automatically populates by default the field with a predefined value or an expression-based one. For example, you can:
- use $x, $length, $area to populate a field with the feature’s x coordinate, length, area or any geometric information at its creation;
- incremente a field by 1 for each new feature using maximum("field")+1;
- save the feature creation datetime using now();
- use variables in expressions, making it easier to e.g. insert the operator name (@user_full_name), the project file path (@project_path), ...
A preview of the resulting default value is displayed at the bottom of the widget.
Note
The Default value option is not aware of the values in any other field of the feature being created so it won’t be possible to use an expression combining any of those values i.e using an expression like concat(field1, field2) may not work.
Constraints: you can constrain the value to insert in the field. This constraint can be:
- Not null: force the user to provide a value
based on a custom expression: e.g. regexp_match(col0,'A-Za-z') to ensure that the value of the field col0 has only alphabetical letter.
A short description of the constraint can be added and will be displayed at the top of the form as a warning message when the value supplied does not match the constraint.
Edit widgets
The available widgets are:
- Checkbox: Displays a checkbox, and you can define what attribute is added to the column when the checkbox is activated or not.
- Classification: Displays a combo box with the values used for classification, if you have chosen ‘unique value’ as legend type in the Style tab of the properties dialog.
- Color: Displays a color button allowing user to choose a color from the color dialog window.
Date/Heure : Affiche un champ de type date/heure qui peut ouvrir un calendrier permettant de choisir une date, une heure ou les deux. Le champ doit être de type texte. Vous pouvez choisir un format personnalisé, l’affichage d’un calendrier, etc.
- Enumeration: Opens a combo box with values that can be used within the columns type. This is currently only supported by the PostgreSQL provider.
- External Resource: Uses a “Open file” dialog to store file path in a relative or absolute mode. It can also be used to display a hyperlink (to document path), a picture or a web page.
- File Name: Simplifies the selection by adding a file chooser dialog.
Cachée : Un attribut caché sera invisible. L’utilisateur ne pourra pas visualiser son contenu.
- Photo: Field contains a filename for a picture. The width and height of the field can be defined.
Plage : Vous permet de spécifier une plage de valeurs numériques disponibles. Il peut s’agir d’une barre coulissante ou d’une zone de texte éditable.
- Relation Reference: This widget lets you embed the feature form of the referenced layer on the feature form of the actual layer. See Créer des relations un ou plusieurs à plusieurs.
- Text Edit (default): This opens a text edit field that allows simple text or multiple lines to be used. If you choose multiple lines you can also choose html content.
- Unique Values: You can select one of the values already used in the attribute table. If ‘Editable’ is activated, a line edit is shown with autocompletion support, otherwise a combo box is used.
- UUID Generator: Generates a read-only UUID (Universally Unique Identifiers) field, if empty.
- Value Map: A combo box with predefined items. The value is stored in the attribute, the description is shown in the combo box. You can define values manually or load them from a layer or a CSV file.
- Value Relation: Offers values from a related table in a combobox. You can select layer, key column and value column. Several options are available to change the standard behaviours: allow null value, order by value, allow multiple selections and use of autocompleter. The forms will display either a drop-down list or a line edit field when completer checkbox is enabled.
- Web View: Field contains a URL. The width and height of the field is variable.
Astuce
Relative Path in widgets
If the path which is selected with the file browser is located in the same directory as the .qgs project file or below, paths are converted to relative paths. This increases portability of a .qgs project with multimedia information attached. This is enabled only for File Name, Photo and Web View at this moment.
Customize a form for your data
By default, when you click on a feature with the  Identify
Features tool or switch the attribute table to the form view mode, QGIS
displays a form with tabulated textboxes (one per field). This rendering is
the result of the default Autogenerate value of the Layer
properties ‣ Fields ‣ Attribute editor layout setting. Thanks to the
widget setting, you can improve this dialog.
Identify
Features tool or switch the attribute table to the form view mode, QGIS
displays a form with tabulated textboxes (one per field). This rendering is
the result of the default Autogenerate value of the Layer
properties ‣ Fields ‣ Attribute editor layout setting. Thanks to the
widget setting, you can improve this dialog.
You can furthermore define built-in forms (see figure_fields_form), e.g. when you have objects with many attributes, you can create an editor with several tabs and named groups to present the attribute fields.
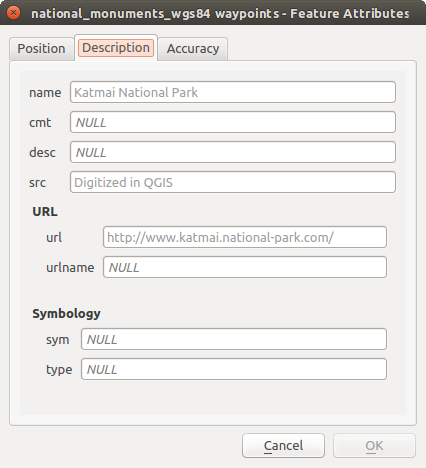
Formulaire intégré obtenu avec onglets et groupes nommés
The drag and drop designer
Choose Drag and drop designer from the Attribute editor layout combobox to layout the features form within QGIS. Then, drag and drop rows from the Fields frame to the Label panel to have fields added to your custom form.
You can also use categories (tab or group frames) to better structure the form.
The first step is to use the icon to create a tab in which fields
and groups will be displayed (see figure_fields_layout). You can create as many
categories as you want.
The next step will be to assign to each category the relevant fields, using the
 icon. You’d need to select the targeted category beforehand.
You can use the same fields many times.
icon. You’d need to select the targeted category beforehand.
You can use the same fields many times.
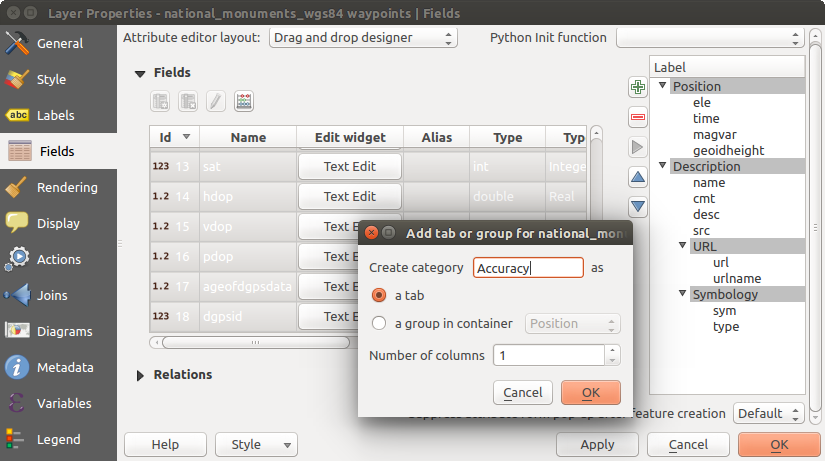
Fenêtre de création de catégories avec la Mise en page de l’éditeur d’attribut
You can configure tabs or groups with a double-click. QGIS opens a form in which you can:
- choose to hide or show the item label
- rename the category
- set over how many columns the fields under the category should be distributed
- enter an expression to control the category visibility. The expression will be re-evaluated everytime values in the form change and the tab or groupbox shown/hidden accordingly.
- show the category as a group box (only available for tabs)
With a double-click on a field label, you can also specify whether the label of its widget should be visible or not in the form.
In case the layer is involved in one to many relations (see Créer des relations un ou plusieurs à plusieurs), referencing layers are listed in the Relations frame and their form can be embedded in the current layer form by drag-and-drop. Like the other items, double-click the relation label to configure some options:
- choose to hide or show the item label
- show the link button
- show the unlink button
Provide an ui-file
The Provide ui-file option allows you to use complex dialogs made with Qt-Designer. Using a UI-file allows a great deal of freedom in creating a dialog. Note that, in order to link the graphical objects (textbox, combobox...) to the layer’s fields, you need to give them the same name.
Use the Edit UI to define the path to the file to use.
You’ll find some example in the Creating a new form lesson of the Manuel d’exercice Qgis. For more advanced information, see http://nathanw.net/2011/09/05/qgis-tips-custom-feature-forms-with-python-logic/.
Enhance your form with custom functions
QGIS forms can have a Python function that is called when the dialog is opened. Use this function to add extra logic to your dialogs. The form code can be specified in three different ways:
- load from the environment: use a function, for example in startup.py or from an installed plugin)
- load from an external file: a file chooser will appear in that case to allow you to select a Python file from your filesystem
- provide code in this dialog: a Python editor will appear where you can directly type the function to use.
In all cases you must enter the name of the function that will be called (open in the example below).
Un exemple (dans le module MyForms.py):
def open(dialog,layer,feature):
    geom = feature.geometry()
    control = dialog.findChild(QWidged,"My line edit")
Reference in Python Init Function like so: open
Propriétés des Jointures
 L’onglet Jointures permet de joindre une table attributaire chargée à une couche vecteur chargée. Après avoir cliqué sur le bouton , la fenêtre Ajouter une jointure vectorielle apparaît. Vous devez définir une couche de jointure à connecter à la couche cible. Ensuite, vous devez définir un champ de jointure qui sera commun à la table à joindre et à la table attributaire de la couche cible. Vous pouvez enfin spécifier la liste des champs à joindre en cochant la case Choisir les champs à joindre. Il en résulte que toutes les informations de la table à joindre seront affichés en plus des champs de la table cible. Si vous avez spécifié une liste de champs à joindre, seuls ceux-ci apparaîtront dans la table attributaire de la couche cible.
Actuellement, QGIS gère les jointures de tables non spatiales aux formats pris en charge par OGR (par exemple CSV, DBF, Excel), au format texte délimité et issues de PostgreSQL (voir figure_joins).
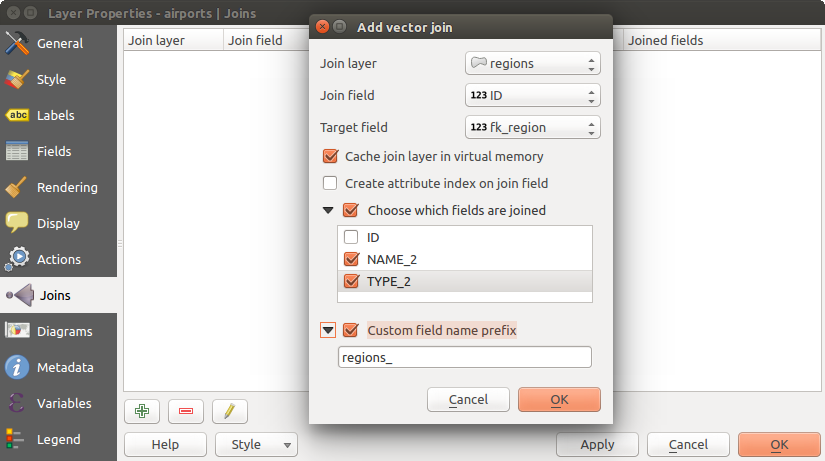
Joindre une table attributaire à une couche vectorielle existante
De plus, la fenêtre de jointure vous permet de :
- Cache join layer in virtual memory
- Créer un index des attributs joins
- Choisir les champs à joindre
- Personnaliser le préfixe du champ
Propriétés des Diagrammes
L’onglet Diagrammes permet d’ajouter une couche de graphiques sur une couche vecteur (voir figure_diagrams_attributes).
Cet onglet permet de générer :
- pie charts, a circular statistical graphic divided into slices to illustrate numerical proportion. The arc length of each slice is proportional to the quantity it represents,
- text diagrams, a horizontaly divided circle showing statistics values inside
- and histograms.
Astuce
Basculer rapidement entre les types de diagrammes
Étant donné que les paramètres sont presque tous communs aux différents types de diagramme, lorsque vous paramétrez votre diagramme, vous pouvez facilement modifier le type de diagramme et retenir celui qui est le plus adapté à vos données sans perdre aucun paramètre.
Pour chaque type de diagramme, les propriétés sont divisées en plusieurs onglets:
:ref:` Attributs <diagram_attributes>`
- Appearance
- Options
Attributs
L’onglet Attributs permet de définir les variables à afficher dans le diagramme. Utilisez le bouton ajouter un élément pour ajouter les champs sélectionnés dans le panneau ‘Attributs utilisés’. Les attributs générés avec les expressions vecteurs peuvent également être utilisés.
Vous pouvez déplacer en haut et en bas n’importe quelle ligne avec un clic et un déplacement, pour trier l’affichage des attributs. Vous pouvez également modifier l’étiquette dans la colonne ‘Légende’ ou la couleur de l’attribut en double-cliquant sur l’élément.
This label is the default text displayed in the legend of the print composer or of the layer tree.
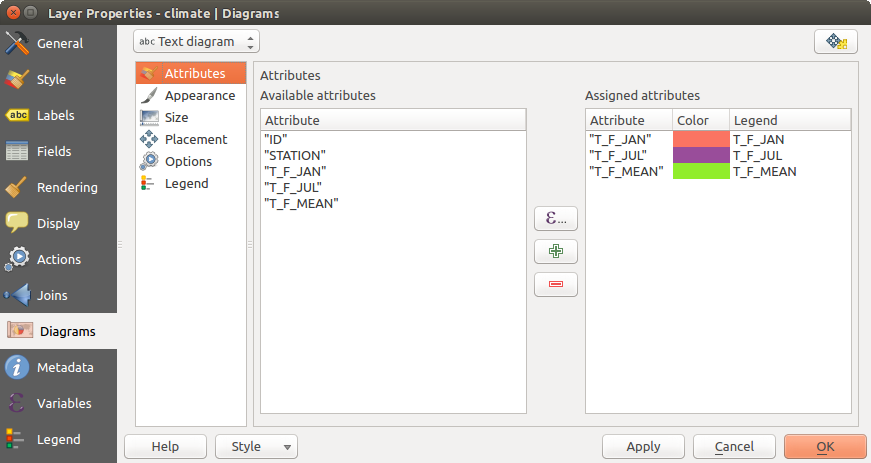
Propriétés du Diagramme - onglet Attributs
Appearance
Appearance defines how the diagram looks like. It provides general settings that do not interfere with the statistic values such as:
- the graphic transparency, its outline width and color
- the width of the bar in case of histogram
- the circle background color in case of text diagram, and the font used for texts
L’orientation de la ligne située à gauche du premier quartier affiché dans un camembert. Les quartiers sont affichés dans le sens des aiguilles d’une montre.
In this tab, you can also manage the diagram visibility:
- by removing diagrams that overlap others or Show all diagrams even if they overlap each other
- by selecting a field with Data defined visibility to precisely tune which diagrams should be rendered
- by setting the scale visibility
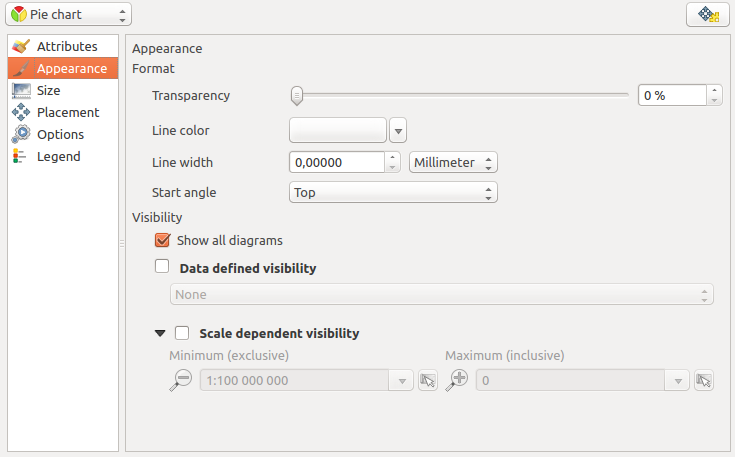
Diagram properties - Appearance tab
Taille
Size is the main tab to set how the selected statistics are represented. The diagram size units can be ‘Map Units’ or ‘Millimeters’. You can use :
Une Taille fixe, une taille unique pour représenter les diagrammes de toutes les entités, à l’exception des histogrammes.
Ou une Taille pondérée, basée sur une expression utilisant les attributs de la couche.
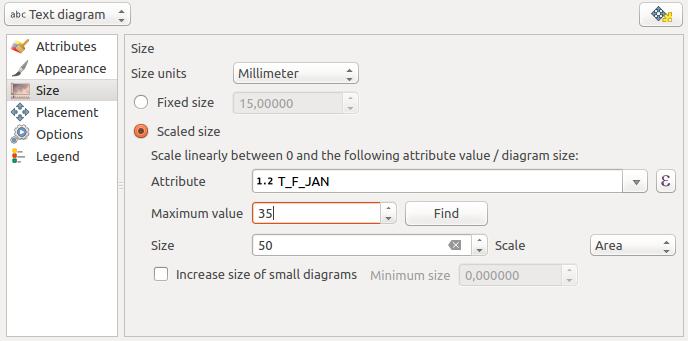
Propriétés du Diagramme - onglet Taille
Emplacement
L’onglet Emplacement permet de définir la position du diagramme. Selon le type gémétrique de la couche, il présente différentes options de placement:
‘Sur le point’ ou ‘Autour du point’ pour les géométries ponctuelles. La dernière variable impose de paramétrer un rayon maximal.
‘Sur la ligne’ ou ‘A côté de la ligne’ pour les géométries linéaires. Comme pour les entités ponctuelles, la dernière option impose une distance à respecter et l’utilisateur peut indiquer un placement du diagramme relatif à l’entité (‘au-dessus’, ‘sur’ et/ou ‘en-dessous’ de la ligne). Il est possible de sélectionner plusieurs options à la fois. Dans ce cas, QGIS cherchera la position optimale du diagramme. Vous pouvez également utiliser l’orientation de la ligne pour positionner le diagramme.
‘Sur le centroïde’, ‘Autour du centroïde’ (avec une distance paramétrée), ‘Sur le périmètre’ et n’importe où ‘A l’intérieur du polygone’ sont les options pour les entités polygones.
The diagram can also be placed using feature data by filling the X and Y fields with an attribute of the feature.
The placement of the diagrams can interact with the labeling, so you can detect and solve position conflicts between diagrams and labels by setting the Priority slider or the z-index value.
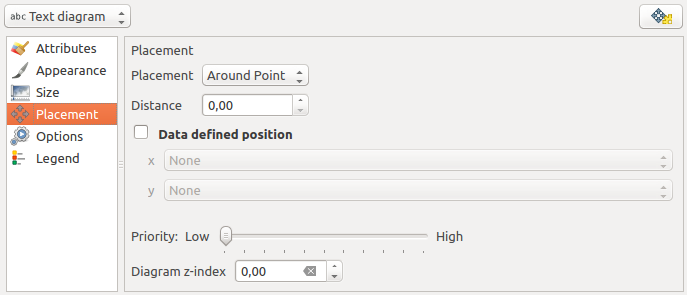
Onglet Diagrammes de la fenêtre de Propriétés d’une couche vecteur, sous-onglet Emplacement
Options
L’onglet Options offre des paramètres uniquement pour les histogrammes. Vous pouvez choisir si l’orientation de la barre est de type ‘Monter’, ‘Descendre’, ‘Droite’ ou ‘Gauche’.
Légende
From the Legend tab, you can choose to display items of the diagram in the Le panneau Couches, besides the layer symbology. It can be:
- the represented attributes: color and legend text set in Attributes tab
- and if applicable, the diagram size, whose symbol you can customize.
When set, the diagram legend items are also available in the print composer legend, besides the layer symbology.
Exemple d’utilisation
Nous allons vous montrer un exemple en superposant aux frontières de l’Alaska des données concernant la température issues d’une couche vecteur portant sur le climat. Toutes ces couches sont disponibles dans l’échantillon de données QGIS (voir section Sample Data).
Tout d’abord, cliquez sur le bouton
 Ajouter une couche vecteur, naviguez jusqu’au jeu de données exemples de QGIS et ajoutez les deux couches alaska.shp et climate.shp.
Double-cliquez sur la couche climate dans la légende pour ouvrir la fenêtre de Propriétés de la Couche.
- Click on the Diagrams tab and from the Diagram type
combo box, select ‘Text diagram’.
Dans l’onglet Apparence, nous choisissons le bleu clair comme couleur de fond et définissons une taille fixe de 18 mm dans l’onglet Taille.
Dans l’onglet Position, l’emplacement défini est Autour du point.
Sur le diagramme, nous souhaiterions afficher les valeurs de trois colonnes T_F_JAN, T_F_JUL et T_F_MEAN. Donc dans le sous-onglet Attributs, sélectionnez T_F_JAN et cliquez sur le bouton
puis faites de même avec les colonnes T_F_JUL et enfin T_F_MEAN.- Now click [Apply] to display the diagram in the QGIS main window.
Vous pouvez adapter la taille du graphique dans l’onglet Taille. Activez l’option
Taille variable et définissez la taille des diagrammes en fonction de la Valeur maximale d’un attribut et de l’option Taille. Si les diagrammes apparaissent trop petits à l’écran, vous pouvez cocher la case Augmenter la taille des petits diagrammes et définir la Taille minimale des diagrammes.Changez les couleurs des attributs en double-cliquant sur les rectangles colorés dans le champ Attributs utilisés. Figure_diagrams_mapped donne un aperçu du résultat.
- Finally, click [Ok].
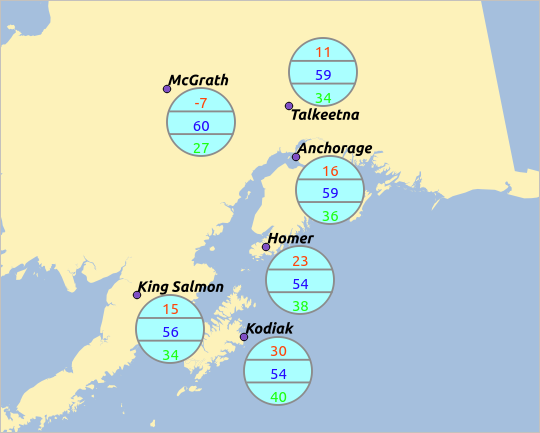
Diagrammes issus de données de températures sur une carte
N’oubliez pas que, dans l’onglet Position, en cochant la case Source de définition de la position, vous pouvez utiliser des valeurs d’attributs pour choisir l’emplacement des diagrammes. Par ailleurs, dans l’onglet Apparence, vous pouvez définir la visibilité en fonction de l’échelle.
La taille et les attributs peuvent aussi être une expression. Utilisez le bouton pour ajouter une expression. Voir Expressions pour plus d’informations et des exemples.
Utiliser des valeurs de paramètres définies par les données
Comme mentionné ci-dessus, vous pouvez utiliser des paramètres définis par les données pour améliorer le rendu de vos diagrammes :
la position dans le sous-onglet Emplacement en renseignant les champs X et Y.
la visibilité dans le sous-onglet Apparence en renseignant le champ Visibilité.
Voir Utiliser des valeurs de paramètres définies par les données pour l’étiquetage pour plus d’informations.
Propriétés des Actions
 QGIS est capable d’effectuer des actions basées sur les attributs d’une entité. Il peut s’agir de nombreuses actions, par exemple exécuter un programme avec des arguments construits à partir des attributs d’une entité, ou encore, passer des paramètres à un outil de publication de rapports sur internet.
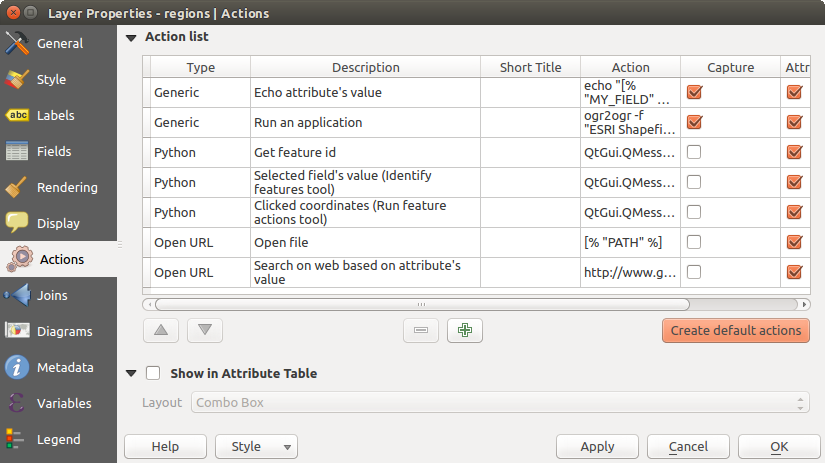
Vue d’ensemble de la fenêtre Actions avec quelques exemples d’actions
Les actions sont utiles si vous voulez exécuter fréquemment une application externe ou charger une page web basée sur une ou plusieurs valeurs de votre couche vecteur. Il en existe six types qui peuvent être utilisés de la sorte :
Les actions de type Générique, Mac, Windows et Unix lancent un processus externe.
Les actions Python lancent un code Python.
Les actions de type Générique et Python sont disponibles quel que soit le système d’exploitation.
Les actions Mac, Windows et Unix sont disponibles uniquement depuis les systèmes d’exploitation correspondants (c’est à dire que vous pouvez définir trois actions ‘Éditer’ qui ouvrent un éditeur et les utilisateurs ne verront que l’action correspondant à leur système d’exploitation).
There are several examples included in the dialog. You can load them by clicking on [Create default actions]. To edit any of the examples, double-click its row. One example is performing a search based on an attribute value. This concept is used in the following discussion.
Définir des Actions
To define an attribute action, open the vector Layer
Properties dialog and click on the Actions tab. In the
Actions tab, click the Add a new action
to open the Edit Action dialog.
Select the action Type and provide a descriptive name for the action. The action itself must contain the name of the application that will be executed when the action is invoked. You can add one or more attribute field values as arguments to the application. When the action is invoked, any set of characters that start with a % followed by the name of a field will be replaced by the value of that field. The special characters %% will be replaced by the value of the field that was selected from the identify results or attribute table (see using_actions below). Double quote marks can be used to group text into a single argument to the program, script or command. Double quotes will be ignored if preceded by a backslash.
Si vous avez des noms de champs qui sont contenus dans d’autres noms de champs (par exemple, col1 et col10), vous devez l’indiquer en entourant le nom de champ (le caractère %) par des crochets (par exemple [%col10]). Ceci évitera de prendre le nom de champ %col10 pour %col1 avec un 0 à la fin. Les crochets seront retirés quand QGIS substituera le nom par la valeur du champ. Si vous voulez que le champ à substituer soit entouré de crochets, utilisez un deuxième jeu de crochets comme ceci : [[%col10]].
En utilisant l’outil Identifier les entités, vous ouvrez la fenêtre Identifier les résultats. Elle inclut une entrée (Dérivé) qui contient des informations pertinentes selon le type de couche. Les valeurs de cette entrée sont accessibles de la même manière que les autres champs en ajoutant (Derived). avant le nom du champ. Par exemple, une couche de points a un champ X et Y et leurs valeurs peuvent être utilisées dans l’action avec %(Derived).X et %(Derived).Y. Les attributs dérivés sont disponibles uniquement depuis la fenêtre Identifier les résultats mais pas par la Table d’attributs.
Deux exemples d’action sont proposés ci-dessous :
- konqueror http://www.google.com/search?q=%nam
- konqueror http://www.google.com/search?q=%%
In the first example, the web browser konqueror is invoked and passed a URL to open. The URL performs a Google search on the value of the nam field from our vector layer. Note that the application or script called by the action must be in the path, or you must provide the full path. To be certain, we could rewrite the first example as: /opt/kde3/bin/konqueror http://www.google.com/search?q=%nam. This will ensure that the konqueror application will be executed when the action is invoked.
Le deuxième exemple utilise la notation %% dont la valeur ne dépend pas d’un champ en particulier. Quand l’action est invoquée, %% sera remplacé par la valeur du champ sélectionné dans les résultats de l’identification ou dans la table d’attributs.
Utiliser des Actions
Actions can be invoked from either the Identify Results dialog,
an Attribute Table dialog or from Run Feature Action
(recall that these dialogs can be opened by clicking
Identify Features or  Open Attribute Table or
 Run Feature Action). To invoke an action, right
click on the feature and choose the action from the pop-up menu (they should
have been enabled to be displayed in the attribute table). Actions are
listed in the popup menu by the name you assigned when defining the action.
Click on the action you wish to invoke.
Run Feature Action). To invoke an action, right
click on the feature and choose the action from the pop-up menu (they should
have been enabled to be displayed in the attribute table). Actions are
listed in the popup menu by the name you assigned when defining the action.
Click on the action you wish to invoke.
Si vous faites appel à une action qui utilise la notation %%, faites un clic droit sur la valeur du champ que vous souhaitez passer à l’application ou au script, dans la fenêtre Identifier les résultats ou dans la Table attributaire.
Voici un autre exemple qui récupère des données d’une couche vecteur et qui les insère dans un fichier utilisant bash et la commande echo (cela ne marchera que sur  et peut-être
  ). La couche en question a des champs pour le nom d’espèce taxon_name, la latitude lat et la longitude long. Nous souhaiterions faire une sélection spatiale de localisations et exporter les valeurs des enregistrements sélectionnés dans un fichier texte (ils apparaissent en jaune sur la carte dans QGIS). Voici l’action qui permettra de le faire :
bash -c "echo \"%taxon_name %lat %long\" >> /tmp/species_localities.txt"
Après avoir sélectionné quelques localités et lancé l’action sur chacune d’entre elles, le fichier de destination ressemblera à ceci :
Acacia mearnsii -34.0800000000 150.0800000000
Acacia mearnsii -34.9000000000 150.1200000000
Acacia mearnsii -35.2200000000 149.9300000000
Acacia mearnsii -32.2700000000 150.4100000000
As an exercise, we can create an action that does a Google search on the lakes layer. First, we need to determine the URL required to perform a search on a keyword. This is easily done by just going to Google and doing a simple search, then grabbing the URL from the address bar in your browser. From this little effort, we see that the format is http://google.com/search?q=qgis, where QGIS is the search term. Armed with this information, we can proceed:
Assurez-vous que la couche lakes est chargée.
Ouvrez la fenêtre Propriétés de la couche en double cliquant sur la couche dans la légende ou en faisant un clic droit et en choisissant Propriétés dans le menu qui apparaît.
Cliquez sur l’onglet Actions
click
Add a new action.Entrez un nom pour l’action, par exemple Recherche Google.
Pour l’action, nous devons fournir le nom du programme externe à lancer. Dans ce cas, nous allons utiliser Firefox. Si le programme n’est pas dans votre path, vous devez fournir le chemin complet.
Following the name of the external application, add the URL used for doing a Google search, up to but not including the search term: http://google.com/search?q=
The text in the Action field should now look like this: firefox http://google.com/search?q=
Click on the drop-down box containing the field names for the lakes layer. It’s located just to the left of the [Insert] button.
From the drop-down box, select ‘NAMES’ and click [Insert].
Votre texte Action ressemble maintenant à :
firefox http://google.com/search?q=%NAMES
To finalize and add the action, click the [OK] button.
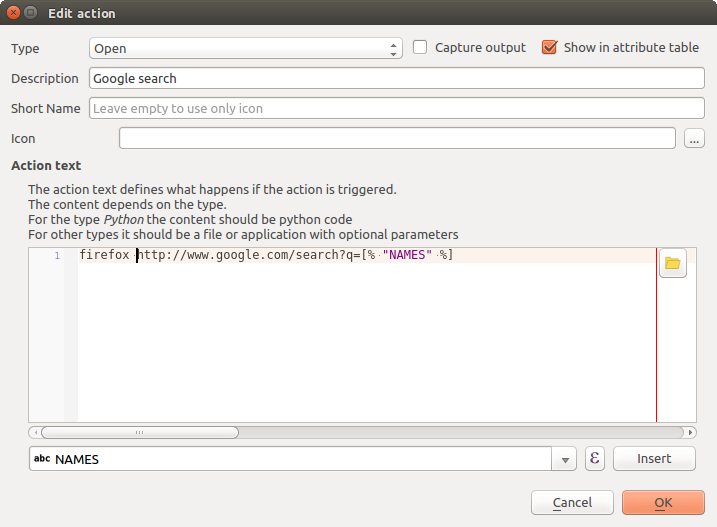
Fenêtre de création de l’action décrite dans l’exemple
L’action est donc entièrement définie et prête à être utilisée. Le texte final de l’action devrait correspondre à ça :
firefox http://google.com/search?q=%NAMES
Nous pouvons maintenant utiliser l’action. Fermez la fenêtre Propriétés de la couche et zoomez sur une zone d’intérêt. Assurez-vous que la couche lakes est active puis identifiez un lac. Dans la fenêtre de résultats, vous constatez que notre action est maintenant visible :
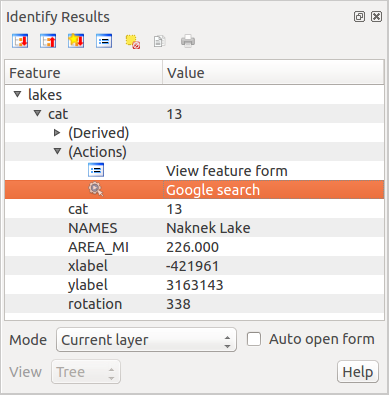
Sélection de l’entité et choix de l’action
When we click on the action, it brings up Firefox and navigates to the URL http://www.google.com/search?q=Tustumena. It is also possible to add further attribute fields to the action. Therefore, you can add a + to the end of the action text, select another field and click on [Insert Field]. In this example, there is just no other field available that would make sense to search for.
Vous pouvez définir de multiples actions pour une couche et chacune apparaitra dans la fenêtre Identifier les résultats.
Depuis la table attributaire, vous pouvez aussi faire appel à des actions via un simple clic droit sur une cellule et sélection de l’action dans la fenêtre qui s’ouvre.
Vous pouvez imaginer toutes sortes d’utilisations pour ces actions. Par exemple, si vous avez une couche de points contenant la localisation d’images ou de photos ainsi qu’un nom de fichier, vous pouvez créer une action qui lancera un visualiseur pour afficher les images. Vous pouvez également utiliser les actions pour lancer des rapports sur internet pour un champ attributaire ou une combinaison de champs, en les spécifiant de la même manière que dans l’exemple d’une recherche Google.
Nous pouvons également fournir des exemples plus complexes, notamment sur la manière d’utiliser des actions Python.
Usually, when we create an action to open a file with an external application, we can use absolute paths, or eventually relative paths. In the second case, the path is relative to the location of the external program executable file. But what about if we need to use relative paths, relative to the selected layer (a file-based one, like a shapefile or SpatiaLite)? The following code will do the trick:
command = "firefox"
imagerelpath = "images_test/test_image.jpg"
layer = qgis.utils.iface.activeLayer()
import os.path
layerpath = layer.source() if layer.providerType() == 'ogr'
  else (qgis.core.QgsDataSourceURI(layer.source()).database()
    if layer.providerType() == 'spatialite' else None)
path = os.path.dirname(str(layerpath))
image = os.path.join(path,imagerelpath)
import subprocess
subprocess.Popen( [command, image ] )
Il faut simplement se rappeler qu’il s’agit d’une action Python et qu’il faut modifier les variables command et imagerelpath selon vos besoins.
Et si le chemin relatif doit dépendre du fichier de projet (sauvegardé) ? Le code de l’action Python deviendra :
command = "firefox"
imagerelpath = "images/test_image.jpg"
projectpath = qgis.core.QgsProject.instance().fileName()
import os.path
path = os.path.dirname(str(projectpath)) if projectpath != '' else None
image = os.path.join(path, imagerelpath)
import subprocess
subprocess.Popen( [command, image ] )
Un autre exemple d’action Python consiste à ajouter de nouvelles couche au projet. L’exemple qui suit montre comment ajouter une couche vecteur et un raster. Les noms des fichiers à ajouter au projet et les noms à donner aux couches dépendent de données attributaires (filename et layername sont deux champs de la table attributaire de la couche sur laquelle l’action est créée) :
qgis.utils.iface.addVectorLayer('/yourpath/[% "filename" %].shp',
  '[% "layername" %]', 'ogr')
Pour ajouter un raster (ici une image TIF), cela devient :
qgis.utils.iface.addRasterLayer('/yourpath/[% "filename" %].tif',
  '[% "layername" %]')
Propriétés des Infobulles
 This tab is specifically created for map tips: display a message in
the map canvas when hovering over a feature of the active layer.
This message can either be the value of a Field
or a more complex and full HTML text mixing fields,
expressions and html tags (multiline, fonts, images,
hyperlink ...).
This tab is specifically created for map tips: display a message in
the map canvas when hovering over a feature of the active layer.
This message can either be the value of a Field
or a more complex and full HTML text mixing fields,
expressions and html tags (multiline, fonts, images,
hyperlink ...).
To activate Map Tips, select the menu option View ‣ Map Tips
or click on the Map Tips icon. Map tip is a cross-session feature
meaning that once activated, it stays on and apply to any set layer in any project,
even in future QGIS sessions until it’s toggled off.
Figures Display Code and Mapped show an example of HTML code and how it behaves in map canvas.
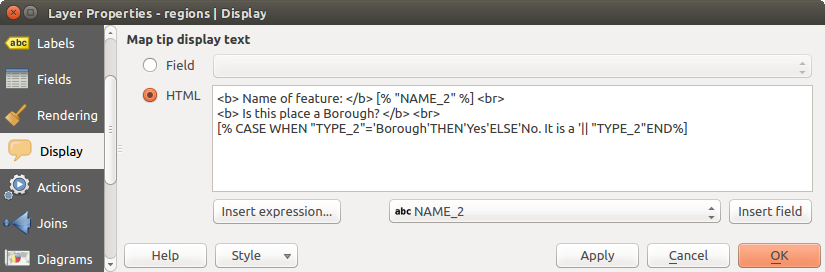
Code HTML pour les infobulles
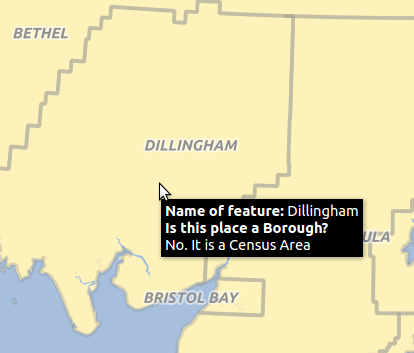
Infobulles basées sur du code HTML
Propriétés de Rendu
 QGIS offers support for on-the-fly feature generalisation. This can
improve rendering times when drawing many complex features at small scales.
This feature can be enabled or disabled in the layer settings using the
Simplify geometry option. There is also a global
setting that enables generalisation by default for newly added layers (see
global simplification for more information).
QGIS offers support for on-the-fly feature generalisation. This can
improve rendering times when drawing many complex features at small scales.
This feature can be enabled or disabled in the layer settings using the
Simplify geometry option. There is also a global
setting that enables generalisation by default for newly added layers (see
global simplification for more information).
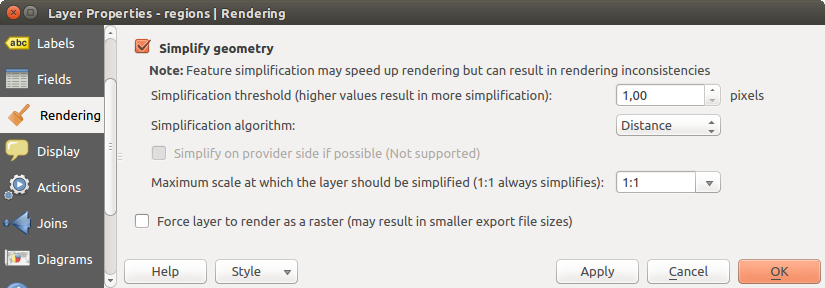
Fenêtre de simplification de la géométrie d’une couche
Note
La simplification d’entité peut engendrer des artefacts dans les sorties d’affichage dans certains cas. Il peut s’agir de trous entre les polygones et d’affichage imprécis lors de l’utilisation de couches de symboles basées sur des décalages.
While rendering extremely detailed layers (e.g. polygon layers with a huge number of nodes), this can cause composer exports in PDF/SVG format to be huge as all nodes are included in the exported file. This can also make the resultant file very slow to work with/open in other programs.
En cochant la case Force l’affichage de la couche en tant que raster, les couches sont rasterisées de manière à ce que les fichiers exportés n’incluent pas l’ensemble des noeuds des couches et que le rendu se fasse plus rapidement.
You can also do this by forcing the composer to export as a raster, but that is an all-or-nothing solution, given that the rasterisation is applied to all layers.
Propriétés des Métadonnées
 The Metadata tab consists of Description,
Attribution, MetadataURL, LegendUrl
and Properties sections.
The Metadata tab consists of Description,
Attribution, MetadataURL, LegendUrl
and Properties sections.
In the Properties section, you get general information about the layer, including specifics about the type and location, number of features, feature type, and editing capabilities. The Extents table provides you with information on the layer extent and the Layer Spatial Reference System, which is information about the CRS of the layer. This can provide a quick way to get useful information about the layer.
Additionally, you can add or edit a title and abstract for the layer in the Description section. It’s also possible to define a Keyword list here. These keyword lists can be used in a metadata catalog. If you want to use a title from an XML metadata file, you have to fill in a link in the DataUrl field.
Utilisez le groupe Attribution pour récupérer les données d’attributs depuis un catalogue de métadonnées XML.
Dans le groupe URL Métadonnées, vous pouvez définir le chemin général d’accès au catalogue de métadonnées XML. Cette information sera stockée dans le fichier de projet QGIS pour les sessions à venir et sera utilisée par QGIS Server.
Dans la section LegendUrl, vous pouvez renseigner l’URL d’une image de légende dans le champ approprié. Vous pouvez utiliser l’option de liste déroulante pour choisir le format de l’image. Pour le moment, seuls les formats png, jpg et jpeg sont pris en compte.
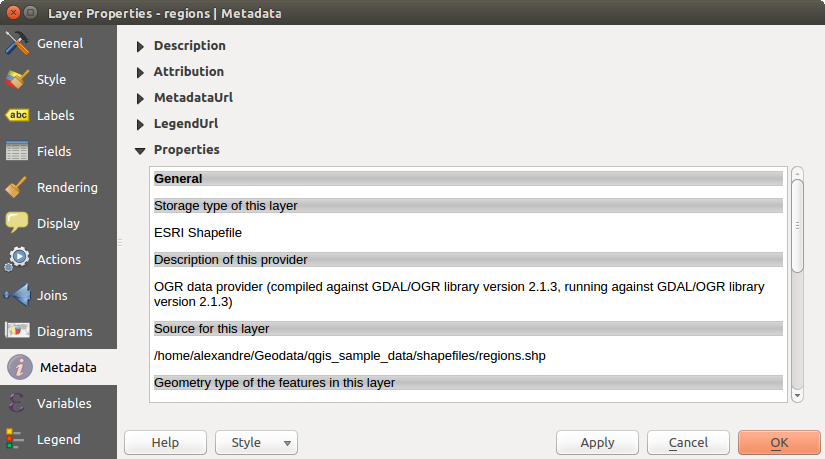
Metadata tab in vector layers properties dialog
Astuce
Passer rapidement d’un style de représentation d’une couche à un autre
Using the Styles ‣ Add combobox at the bottom of the Layer Properties dialog, you can save as many combinations of layer properties settings (symbology, labeling, diagram, fields form, actions...) as you want. Then, simply switch between styles from the context menu of the layer in Layers Panel to automatically get different representations of your data.
Propriétés des Variables
The Variables tab lists all the variables available at
the layer’s level (which includes all global and project’s variables).
It also allows the user to manage layer-level variables. Click the
button to add a new custom layer-level variable. Likewise, select a custom
layer-level variable from the list and click the button to remove
it.
More information on variables usage in the General Tools Variables section.
Propriétés de la Légende
 The Legend tab provides you with a list of widgets you
can embed within the layer tree in the Layers panel. The idea is to have a
way to quickly access some actions that are often used with the layer (setup
transparency, filtering, selection, style or other stuff...).
The Legend tab provides you with a list of widgets you
can embed within the layer tree in the Layers panel. The idea is to have a
way to quickly access some actions that are often used with the layer (setup
transparency, filtering, selection, style or other stuff...).
By default, QGIS provides transparency widget but this can be extended by plugins registering their own widgets and assign custom actions to layers they manage.