重要
翻訳は あなたが参加できる コミュニティの取り組みです。このページは現在 100.00% 翻訳されています。
17.9. プロセシングログ
注釈
このレッスンではプロセシングログを説明します。
プロセシングフレームワークで実行されるすべての分析は、QGISのログシステムに記録されます。これによってプロセシングツールによって行われたことの詳細を知るとか、問題が発生したときにそれを解決することができます。またログシステムもいくつかの対話を実装しているので、以前の操作の再実行もできます。
ログを開くには、QGISのステータスバー右下のバルーンをクリックしてください。いくつかのアルゴリズムは、ここではそれらの実行に関する情報を残すことがあります。例えば、外部アプリケーションを呼び出すアルゴリズムは、通常、そのアプリケーションのコンソール出力をこのエントリにログ出力します。それを見ると、私たちが実行した(そして入力データが正しくなかったので実行に失敗した)ばかりのSAGAアルゴリズムの出力がここに格納されていることが分かります。
これは、何が起こっているか理解するのに便利です。上級ユーザーは、その出力を分析して、アルゴリズムが失敗した理由を探せるでしょう。上級ユーザーでなければ、持っている問題を診断するのを他の人に助けてもらうために有用でしょう。外部のソフトウェアのインストール中の問題であるかもしれないし、提供されたデータの問題であるかもしれません。
アルゴリズムには、そのアルゴリズムが実行できたとしても結果が正しくないかもしれない場合に警告を残すものがあります。例えば、非常に少ない点で補間アルゴリズムを実行するとき、アルゴリズムは実行できて結果は作成されますが、より多くの点が使用されなければならないので、それは正しくない可能性が高いです。指定されたアルゴリズムのいくつかの側面に確信がない場合は、定期的にこのタイプの警告をチェックすることをお勧めします。
GUIや(このマニュアルの後半で説明する)コンソールから実行されたかに関係なく、 メニューから実行された アルゴリズム を見つけることができます。実行内容はコンソール呼び出しとしてこのダイアログに保存されます。つまり、アルゴリズムを実行するたびに、コンソールコマンドがログに追加され、作業セッションの完全な履歴が残ります。その履歴は以下のようなものです:
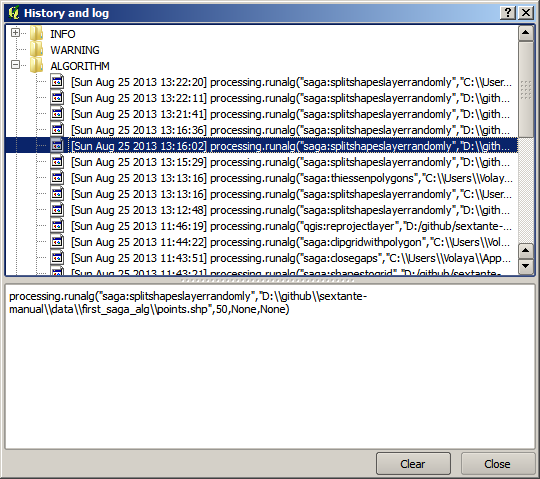
これはコンソールを使い始めるときに、アルゴリズムの構文を学ぶのに非常に便利です。コンソールから分析コマンドを実行する方法について説明するときにも使います。
17.9.1. ★☆☆ (初級レベル) 理解しよう
履歴は対話的でもあり、そのエントリをダブルクリックするだけで、以前のアルゴリズムを実行できます。これは、以前に行なった作業を繰り返す簡単な方法です。
例として、次のように試してみて下さい:
このマニュアルの第1章に対応するデータを開き、そこで説明されているアルゴリズムを実行します。
次に履歴ダイアログに行き、今実行したアルゴリズムに対応した最後のアルゴリズムをリストから探します。
それをダブルクリックすると、通常のダイアログを使ってツールボックスから呼び出したときと同じように、新しい結果が生成されるはずです。
17.9.2. ★★☆ (中級レベル) 理解しよう
そのアルゴリズムに手を加えることもできます。
アルゴリズムの呼出をコピーします
を開きます
コピーを貼り付けて分析を実行します; パラメータは自由に変更します。
結果のファイルを表示するには、貼り付けたコマンドの
processing.runをprocessing.runAndLoadResultsに置き換えるとよいでしょう。